Abstract
The specific mechanisms of charged polymer modulation of retrovirus transduction were analyzed by characterizing their effects on virus transport and adsorption. From a standard colloidal perspective two mechanisms, charge shielding and virus aggregation, can potentially account for the experimentally observed changes in adsorption behavior and biophysical parameters due to charged polymers. Experimental testing revealed that both mechanisms could be at work depending on the characteristics of the cationic polymer. All cationic polymers enhanced adsorption and transduction via charge shielding; however, only polymers greater than 15 kDa in size were capable of enhancing these processes via the virus aggregation mechanism, explaining the higher efficiency enhancement of the high molecular weight molecules. The role of anionic polymers was also characterized and they were found to inhibit transduction via sequestration of cationic polymers, thereby preventing charge shielding and virus aggregation. Taken together, these findings suggest the basis for a revised physical model of virus transport that incorporates electrostatic interactions through both virus-cell repulsive and attractive interactions, as well as the aggregation state of the virus.
INTRODUCTION
Recombinant retroviruses are a widely used gene therapy vector because of their ability to permanently integrate a therapeutic transgene into the genome of a target cell (Andreadis et al., 1999; Roth and Yarmush, 1999). However, the relatively low efficiency of retrovirus-mediated gene transfer has resulted in limited clinical success, with only one documented instance of unequivocal therapeutic benefit (Cavazzana-Calvo et al., 2000). Recent work to identify factors limiting retrovirus gene transfer efficiency has revealed that the slow diffusion and rapid decay of retrovirus particles are primary reasons for the low efficiencies (Andreadis et al., 2000; Chuck et al., 1996; Le Doux et al., 1999a), and has highlighted the importance of virus transport in the overall transduction process.
The currently accepted physical model of retrovirus transport suggests that the driving force for virus attachment is provided by the binding affinity between the viral gp70 envelope protein and its cognate cellular receptor (Bukrinskaya, 1982; Coffin et al., 1997; Tardieu et al., 1982; Wickham et al., 1990). This model guided the experimental design of several studies that characterized the kinetics of retrovirus attachment via tracking of gp70, and which led to the conclusion that virus binding is tropism dependent, and its kinetics are governed by the gp70-receptor interaction, as opposed to diffusion (Kadan et al., 1992; Yu et al., 1995). However, great care must be taken when using gp70-based assays to measure virus binding, as the presence of the much more rapidly diffusing free gp70 can make it difficult to determine actual virus binding parameters. Both the gp70 and gp30 virus binding assays are confounded by nonspecific virus adsorption before specific binding between receptor and virus. Importantly, virus attachment is a three step process involving 1), virus diffusion to the proximity of the cell, 2), nonspecific binding of the retrovirus to the cell surface, and 3), specific binding onto a cell surface receptor (Davis et al., 2002). In fact, when virus adsorption is measured using higher specificity, nonenvelope based methods, attachment was actually determined to be irreversible and tropism independent with receptor molecules acting more as fusion triggers (Davis et al., 2002; Pizzato et al., 1999). As this is inconsistent with the receptor-envelope driving force assumed in the current physical model, these findings call for a reevaluation of our current understanding of virus transport.
Previous studies have established that charged polymers modulate transduction efficiency by affecting an early step in the process (Le Doux et al., 1999b). Recent work in our laboratory has focused on the role of charged polymers in retroviral gene transfer, and our findings indicate that cationic polymers enhance and anionic polymers inhibit transduction via altering the kinetics of virus adsorption (Davis et al., 2002; Le Doux et al., 1996). Their ability to modulate transduction is independent of both the virus receptor and envelope, suggesting that the tropism independence of virus adsorption, in general, may be related to the mechanism of action of these compounds.
Based upon this, we proposed an alternative physical model of the initial steps of retrovirus transduction in which virus transport was diffusion limited, with the driving force for virus adsorption provided by nonspecific electrostatic interactions between the virus, target cell, and the exogenous and endogenous charged polymers in the system. As the virus must diffuse to the surface of the cell and adsorb for transduction to begin, it must overcome the electrostatic repulsion imposed by the negative charge on the cell surface as well as repulsive steric entropic forces. Cell charge has been shown to have a significant effect on the adsorption of related viruses (Yang and Yang, 1996). Charged polymers could influence this process via charge shielding, in which the polymers reduce (or enhance) electrostatic repulsion by neutralizing (or augmenting) virus or cell surface charge. Once adsorbed to the cell surface receptors diffuse toward the retrovirus where receptor-virus binding occurs and fusion is triggered. For an excellent recent review of electrostatic, van der Waals, and other intermolecular forces in biology refer to Leckband and Israelachvili (2001) or a current text in the area (Evans and Wennerstrom, 1999; Hiemenz and Rajagopalan, 1997; Hunter, 2001; Israelachvili, 1992; Myers, 1999; Russel et al., 1989). Interaction forces in biology are typically far more complex than can be described by a simple interaction potential diagram (Leckband and Israelachvili, 2001). On the basis of what we know about colloid stability, however, we predict that an increased adsorption rate due to the virus-cell electrostatic repulsion being diminished via charge shielding is one component of the improved viral transduction that results when using positively charged polymers. Alternatively, charged polymers could allow the virus to overcome electrostatic repulsion by aggregation of the virus, thereby enhancing the rate of sedimentation of the virus to the cell surface. As polymer-mediated flocculation of colloidal particles is a well-documented phenomenon, this represents a plausible alternative mechanism for transduction enhancement.
In this report, we test the hypothesis that virus transport and adsorption onto the target cell surfaces is strongly influenced by electrostatic interactions through both virus-cell repulsive-attractive interactions, as well as the aggregation state of the virus. The role of these mechanisms were investigated experimentally using measurements of virus and cell ζ-potential, as well as effective retrovirus diameter in the presence of transduction modulating concentrations of charged polymer over a range of molecular weights. The ramifications of these findings for both in vitro and in vivo retrovirus gene therapy protocols are discussed.
MATERIALS AND METHODS
Chemicals
Nonidet P-40, 1,5-dimethyl-1,5-diazaundecamethylene polymethobromide (polybrene), neuraminidase, and poly-L-lysine (PLL) (1–4 kDa, 4–15 kDa, 15–30 kDa, 30–70 kDa, 70–150 kDa, 150–300 kDa, and >300 kDa) were purchased from Sigma Chemical (St. Louis, MO). D-Mannosamine hydrochloride was purchased from Calbiochem (San Diego, CA). 5-Bromo-4-chloro-3-indolyl-β-D-galactopyranoside (X-Gal), Pefabloc SC, aprotinin, and o-nitrophenyl-β-D-galactopyranoside (ONPG) were purchased from Roche Biochemicals (Mannheim, West Germany).
Cell culture
NIH 3T3 cells and virus-producing cell lines were cultured in Dulbecco's modified Eagle's medium (DMEM; Gibco BRL, Gaithersburg, MD) with 10% bovine calf serum (HyClone Labs, Logan, UT) containing 100 units/ml penicillin and 100 μg/ml streptomycin (Gibco BRL). Virus containing medium from the ecotropic packaging cell line CRE-BAG (ATCC CRL 1858) were harvested from confluent cultures, filtered through 0.45-μm syringe filters (Gelman Sciences, Ann Arbor, MI), frozen on pulverized dry ice, and stored at −85°C. CHO-K1 cells (ATCC CCL-61) were cultured in Ham's F12 medium (ATCC, Rockville, MD) supplemented with 10% fetal bovine serum (FBS) containing 100 units/ml penicillin and 100 μg/ml streptomycin.
Transduction assay
A microplate assay was used to measure virus infectivity (Morgan et al., 1995). The day before infection, a 10-cm dish of confluent 3T3 cells was treated with trypsin, and the cells were counted with a Coulter counter model ZM (Coulter Electronics, Hialeah, FL). Five thousand cells in 100 μl medium were plated per well in a 96-well flat-bottomed tissue culture dish with a low-evaporation lid (Costar, Cambridge, MA). The next day (19–25 h later), the medium was removed, and dilutions of virus in culture medium with polybrene (8 μg/ml) were added to each well (final volume, 100 μl per well). Two days after the infection, the culture medium was removed, and the cells were washed once with 100 μl phosphate buffered saline (PBS) with 1 mM MgCl2. After removal of the wash solution, 50 μl lysis buffer was added (PBS with 1 mM MgCl2 and 0.5% Nonidet P-40) to each well, and the plate was incubated at 37°C. After 30 min, 50 μl lysis buffer with 6 mM ONPG warmed to 37°C was added to each well, and the plate was incubated at 37°C for another 15 min. The reactions were halted by the addition of 20 μl stop buffer (1 M Na2CO3). The plate was brought to room temperature, and the optical density at 420 nm (OD420) was measured using an absorbance plate reader (Molecular Devices, Menlo Park, CA); nonspecific background at 650 nm was subtracted. Values for replicate wells without virus were subtracted as background. Values for each point are the averages of at least triplicate wells.
Poly-L-lysine adsorption assay
Adsorption of poly-L-lysine to cells was analyzed via flow cytometry. 106 NIH-3T3 cells were trypsinized, pelleted via centrifugation at 100 × g for 5 min, 4°C. The cell pellet was resuspended in 1 ml 1% FBS in PBS (FBS/PBS) containing fluorescein-5′-isothiocyanate (FITC)-labeled, 50-kDa mean molecular mass poly-L-lysine. After incubation for 1 h at 37°C, the cells were pelleted, washed with FBS/PBS, and resuspended in 300 μl FBS/PBS. The cells were analyzed via flow cytometry for forward and side scatter, as well as FITC fluorescence.
Virus adsorption assay
Adsorption of ecotropic virus to cells was analyzed by enzyme-linked immunosorbent assay (ELISA). NIH-3T3 or CHO cells were plated in 6-well dishes (1.5 × 10⁵ per well). The cells were incubated at 37°C for 72 h, yielding a confluent monolayer. The medium was removed and replaced with 1 ml virus stock with or without poly-L-lysine or polybrene. After a 2-h incubation, the cells were washed once with fresh medium and incubated in 0.5 ml cell lysis buffer (1% Triton X-100, 150 mM NaCl, 50 mM Tris-HCl, pH 8.0, 2 mM Pefabloc SC, 1 μg/ml aprotinin, 0.02% sodium azide) for 20 min on ice. Cell debris was removed by centrifugation at 12,000 × g for 2 min at 4°C, and the resulting supernatant was stored at −80°C until analysis for levels of p30 and gp70 by ELISA.
ELISA for p30
Mouse anti-p30 antibody was purified from supernatants harvested from the CRL-1912 (ATCC, Rockville, MD) hybridoma cell lines, following standard protocols (Lane and Harlow, 1988). An ELISA for p30 was performed as described by Forestell et al. (1995). The wells of a 96-well ELISA plate (Fisher Scientific, Agawan, MA) were coated with the anti-p30 capture antibody by overnight incubation at 4°C with 100 μl 10-μg/ml solution of the antibody in PBS. The next day, nonspecific binding sites were blocked by incubating the plate for 30 min at 37°C with 200 μl BLOTTO Blocker in Triton X-100 containing phosphate buffered saline (TBS) (Pierce, Rockford, IL). Samples of clarified cell lysates or supernatant were added to the ELISA plate (100 μl per well) and incubated for 1 h at 37°C. Bound p30 was sandwiched by addition of a secondary goat polyclonal antibody (78S221: Quality Biotech, Camden, NJ) diluted 1:1000 in BLOTTO and incubated for 1 h at 37°C. A horseradish peroxidase conjugated rabbit anti-goat immunoglobulin G polyclonal antibody (Zymed Laboratories, South San Francisco, CA) diluted 1:5000 in BLOTTO was added to the ELISA plate (100 μl per well) and incubated for 1 h at 37°C to enable detection and quantitation of the sandwiched antigen. A stock of retrovirus diluted 1:1 into cell lysis buffer was used as a reference standard to normalize for plate to plate variations in the ELISA results. Serial dilutions of this reference stock produced a linear dose response curve with an r2 = 0.99 up to an OD of 1.5 for p30. Values reported outside these ranges were obtained by diluting the samples in PBS before analysis.
Orange G assay for cell number
NIH-3T3 cells were plated in a 96-well plate at 5000 cells/well. After 24 h, the medium was removed and the replaced with fresh medium with concentrations of polybrene between 0 and 64 μg/ml. After 48 h, the cells were washed with 1mM MgCl2/PBS, and fixed in 10% trichloroacetic acid at 4°C. After 30 min, the cells were washed with distilled water and incubated for 5 min with staining solution (1.5% Orange G, 1% acetic acid in PBS). The cells were washed, air dried, and incubated with 10 mM Tris, pH 7.4, for 5 min with shaking. The optical density at 420 nm (OD420) was measured using an absorbance plate reader (Molecular Devices, Menlo Park, CA); nonspecific background at 650 nm was subtracted. Values for replicate wells without cells were subtracted as background. Values for each point are the averages of at least triplicate wells.
Particle size and ζ-potential analysis
The particle size and ζ-potential of virus and cells were measured via laser light scattering using a ZetaPALS system (Brookhaven Instruments, Holtsville, NY). Cells were prepared by treating a confluent T175 of NIH-3T3 or CHO cells with trypsin, and pelleting the cells at 100 × g, for 5 min, 4°C. The cell pellet was resuspended in isotonic PBS and the cells were counted in a hemacytometer. A quantity of 106 cells was added to a ZetaPALS cuvette containing 2 ml isotonic PBS, and analyzed for particle size and ζ-potential using the ZetaPALS system. Virus was prepared via ultracentrifugation of the stock in a Beckman SW 41.Ti rotor for 1.5 h, at 275,000 × g, 4°C. The resultant virus pellet was resuspended in isotonic PBS at one tenth the original volume, and 20 μl was added to a ZetaPALS cuvette containing 2 ml isotonic PBS for particle size and ζ-potential analysis.
RESULTS AND DISCUSSION
Previously, charged polymers were demonstrated to have potent effects on recombinant retrovirus gene transfer, with cationic polymers enhancing and anionic polymers inhibiting the transduction process. Further inquiry established that these compounds were modulating transport of virus particles to the target cell surface, however, not via interaction with those moieties believed to govern the kinetics of the adsorption step. The current physical model of virus transport assigns the driving force for adsorption to the affinity of gp70 for its cellular receptor, and assumes that virus attachment is a reaction-limited equilibrium process (Bukrinskaya, 1982; Coffin et al., 1997; Tardieu et al., 1982; Wickham et al., 1990). By contrast, our characterization of virus adsorption via assays with greater specificity indicated that adsorption was tropism independent, diffusion limited, and irreversible (Davis et al., 2002). As these findings were incompatible with the current physical model of virus transport, we proposed a new model in which the driving force for adsorption was electrostatic in nature, which was supported by our charged polymer observations. The goal of the work described here was to determine the specific mechanisms of charged polymer modulation of transduction and adsorption, as well as the implication of these mechanisms with regard to the fundamental driving force for virus transport.
Polybrene's enhancement of retrovirus adsorption and transduction is saturable
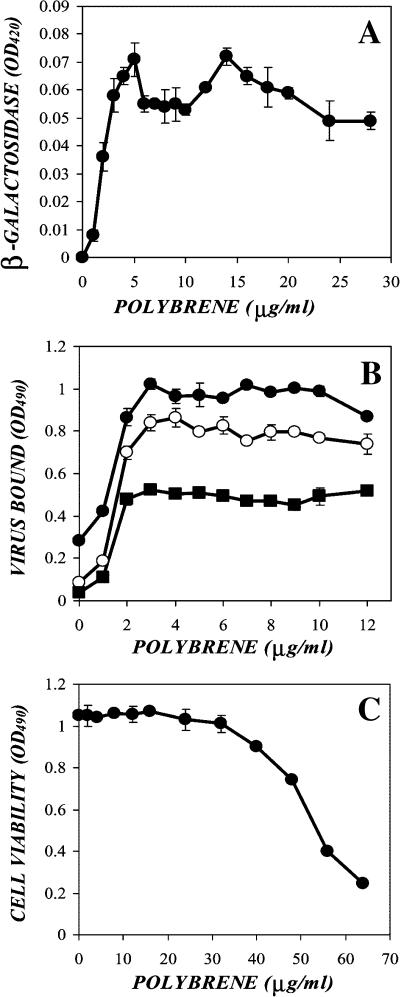
To compare the effects of polybrene on retrovirus adsorption and transduction, we supplemented samples of ecotropic virus with concentrations of polybrene between 0 and 28 μg/ml. To measure transduction efficiency, NIH-3T3 cells were exposed to the virus samples for 48 h, lysed, and β-galactosidase levels were measured using an established ONPG-based assay (Fig. 1 A). The transduction efficiency curve of an ecotropic virus sample exhibited a very steep rise between 1 and 5 μg/ml, followed by a plateau, where further addition of polybrene did not increase transduction. Identical behavior was observed when the effect of increasing cationic polymer concentration on virus adsorption was measured. To measure virus adsorption, confluent NIH-3T3 cells were exposed to the same virus samples for 2 h, lysed, and levels of cell-associated p30 were measured via ELISA (solid circles, Fig. 1 B). Similar to transduction, the virus adsorption curve exhibited a very steep rise between 1 and 4 μg/ml, followed by a plateau region insensitive to further polybrene addition.
FIGURE 1.
Polybrene's enhancement of retrovirus transduction and adsorption is saturable, and is not due to toxicity or limiting concentrations of virus. (A) Ecotropic virus was supplemented with concentrations of polybrene between 0 and 28 μg/ml. NIH-3T3 cells were exposed to the virus samples for 48 h, lysed, and β-galactosidase levels were measured using an established ONPG-based assay. (B) An ecotropic virus stock (solid circles), as well as 1:2 (open circles) and 1:4 (solid squares) dilutions of the stock in fresh medium, were supplemented with between 0 and 12 μg/ml polybrene. Confluent NIH-3T3 cells were exposed to the same virus samples for 2 h, lysed, and levels of cell-associated p30 were measured via ELISA. (C) NIH-3T3 cells were plated in a 96-well plate at 5000 cells/well. After 24 h, the medium was removed and then replaced with fresh medium with concentrations of polybrene between 0 and 64 μg/ml. After 48 h, the relative cell density was measured via Orange G assay.
We verified that this saturation effect was not due to cationic polymer-mediated toxicity or limiting concentrations of virus. To determine whether virus was limiting, we measured the effect of various polybrene doses on different concentrations of virus. Ecotropic virus was diluted 1:2 and 1:4 in fresh medium, supplemented with between 0 and 28 μg/ml polybrene, and adsorption was measured on NIH-3T3 cells via p30 ELISA (open circles and solid squares, Fig. 1 B). Although the level of the plateau varied with concentration of virus in the sample, the polybrene concentration at which the plateau began was identical (∼5 μg/ml), suggesting that virus concentration was not limiting. To determine whether polybrene toxicity was responsible for the plateau in enhancement, the growth of target cells was measured in the presence of a range of polybrene concentrations. NIH-3T3 cells were plated at 5000 cells per well in a 96-well dish and 24 h later the medium was replaced with fresh medium containing polybrene between 0 and 64 μg/ml. After 48 h incubation, the cells were washed, fixed, and the relative cell density was determined via Orange G assay (Fig. 1 C). The cell density remained stable up to 32 mg/ml, beyond which cell density fell off sharply. As the polybrene exposure step of this protocol parallels that of a transduction experiment, this result suggests that polybrene toxicity will not play a factor for concentrations below 32 μg/ml, and thus is not responsible for the enhancement plateau. These findings, however, did not conclusively establish a direct interaction between the polymer and the virus or cell surface, as proposed by the charge shielding hypothesis.
Poly-L-lysine's enhancement of adsorption and transduction is size dependent
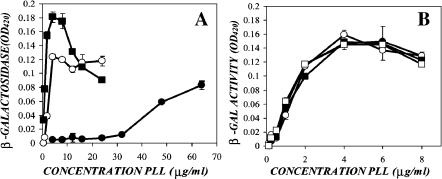
To determine whether there is a molecular weight dependence to cationic polymer enhancement of transduction and adsorption, we measured the effect of various sizes of poly-L-lysine on transduction efficiency. As poly-L-lysine is a homopolymer, all of the poly-L-lysines have identical charge/mass ratios; however, their charge/molecule ratios differ (Table 1). Due to this, addition of identical masses of the various poly-L-lysines will result in the addition of identical amounts of total charge, allowing us to isolate the role of polymer size. Ecotropic virus was supplemented with varying concentrations of a range of poly-L-lysines between 2.5-kDa and 300-kDa mean molecular mass. NIH-3T3 cells were exposed to these samples for 48 h, and transduction was measured via the ONPG assay. The behavior of the poly-L-lysine samples could be separated into a low (1–4 kDa and 4–15 kDa) and a high (15–30 kDa, 30–70 kDa, 70–150 kDa, 150–300 kDa, and >300 kDa) efficiency group based upon the concentration required to achieve a maximal enhancement of transduction. The low molecular weight poly-L-lysine required higher concentrations of polymer to achieve a maximal effect on transduction, with the smallest polymer requiring the highest concentration (Fig. 2 A). In addition, the plateau of transduction enhancement increased with increasing size of the polymer. This behavior contrasts with the high molecular weight range cationic polymers, where all of the poly-L-lysines achieved a maximal enhancement of transduction at 4 μg/ml (Fig. 2 B), as well as exhibiting identical enhancement plateau levels.
TABLE 1.
Normalized charge/mass and charge molecule ratios of cationic polymers
| Mean molecular mass (kDa) | Charge/mass | Charge/molecule | |
|---|---|---|---|
| 1–4-kDa PLL | 2.5 | 1 | 1 |
| Polybrene | 3.6 | 1.44* | 1.44* |
| 4–15-kDa PLL | 9.5 | 1 | 3.8 |
| 15–30-kDa PLL | 22.5 | 1 | 9 |
| 30–70-kDa PLL | 50 | 1 | 20 |
| 70–150-kDa PLL | 110 | 1 | 44 |
| 150–300-kDa PLL | 225 | 1 | 90 |
| >300-kDa PLL | 300 | 1 | 120 |
Although the charge/monomer is the same for polybrene and poly-L-lysine, their monomer structures and therefore charge/mass ratios differ. The charge/molecule is provided for approximate comparison.
FIGURE 2.
Poly-L-lysine's enhancement of virus transduction is size dependent. (A) Ecotropic virus was supplemented with concentrations of 1–4-kDa (solid circles), 4–15-kDa (open circles), or 15–30-kDa (solid squares) poly-L-lysine. NIH-3T3 cells were exposed to the virus samples for 48 h, and transduction was measured via the ONPG assay. (B) Ecotropic virus was supplemented with concentrations of 30–70-kDa (solid circles), 70–150-kDa (open circles), 150–300-kDa (solid squares), or >300-kDa (open squares) poly-L-lysine. NIH-3T3 cells were exposed to the virus samples for 48 h, and transduction was measured via the ONPG assay.
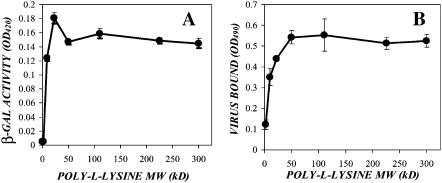
To directly compare the efficiency of the various molecular weight polymers, an ecotropic stock was supplemented with 4 μg/ml of each poly-L-lysine, and transduction was measured via ONPG assay (Fig. 3 A). Despite the addition of identical masses of polymer, and therefore total charge, the high molecular weight poly-L-lysines resulted in greater enhancement than the lower molecular weight. To determine if this phenomenon extended to virus adsorption as well, confluent NIH-3T3s were exposed to samples of ecotropic virus supplemented with 4 μg/ml of each of the poly-L-lysines, and virus adsorption was measured via ELISA (Fig. 3 B). Similar to their effect on transduction, the high molecular weight poly-L-lysines showed identical enhancement of virus adsorption, whereas the low molecular weight poly-L-lysines enhanced less in proportion with their size.
FIGURE 3.
Poly-L-lysine's enhancement of virus adsorption is size dependent and parallels its effect on transduction. Ecotropic virus was supplemented with 4 μg/ml of each molecular weight poly-L-lysine. (A) NIH-3T3 cells were exposed to the virus samples, and after 48 h, β-galactosidase activity was measured via the ONPG assay. (B) Confluent NIH-3T3 cells were exposed to the same samples of virus for 2 h, and adsorption was measured via p30 ELISA.
Adsorption of cationic polymers on target cell surfaces is rapid, dose dependent, and independent of cell type
To begin testing the charge shielding hypothesis, we first attempted to determine whether cationic polymers were adsorbing to target cell membranes. To quantify the levels of adsorbed polymer, we developed a flow cytometry based assay that facilitated the detection of cell-associated, FITC-labeled PLL (FITC-PLL). If FITC-labeled poly-L-lysine adsorption to NIH-3T3 cells is dose dependent and relatively rapid, then we have clear evidence of a direct polymer-cell interaction. NIH 3T3 cells were trypsinized, pelleted via centrifugation, and resuspended in 1% FBS/PBS containing 40 or 0 μg/ml FITC-labeled, 50-kDa mean molecular mass poly-L-lysine. After incubation for 1 h at 37°C, the cells were pelleted, washed once in FBS/PBS, resuspended in ice-cold FBS/PBS, and analyzed via flow cytometry for forward scatter, side scatter, and FITC fluorescence (i.e., 492-nm emission). Cells positive for FITC above background levels were reported as “% cells bound.”
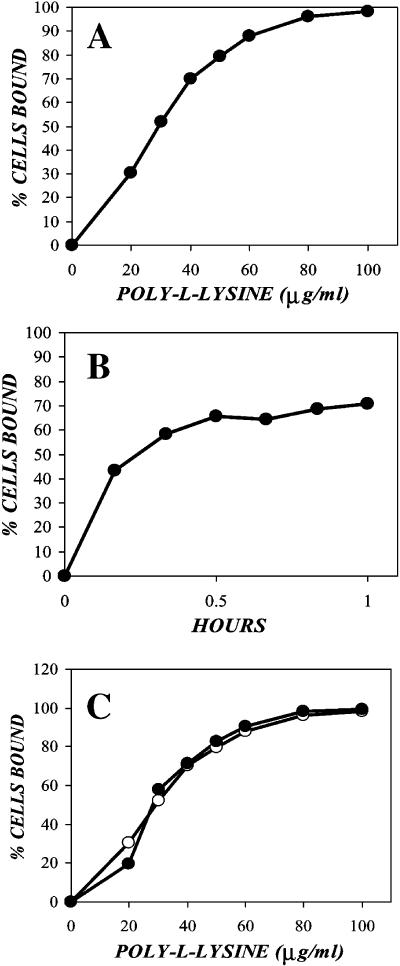
To measure the dose response of PLL adsorption, NIH-3T3 cells were pelleted and resuspended in concentrations of FITC-PLL between 0 and 100 μg/ml. After incubation for 1 h at 37°C, the cells were pelleted, washed in FBS/PBS and analyzed via flow cytometry (Fig. 4 A). Adsorption of PLL to the cells was dose dependent up to 50 μg/ml, above which saturation of the cells occurred. The time course of PLL adsorption on NIH-3T3s was also determined by resuspending the cells in 40 μg/ml FITC-PLL and incubating the cells at 37°C for varying amounts of time, followed by flow cytometry analysis (Fig. 4 B). The percentage of PLL adsorbing cells reached a plateau of ∼65% within 30 min, indicating that the kinetics of the PLL-cell interaction are relatively rapid.
FIGURE 4.
Adsorption of FITC-labeled poly-L-lysine on target cells is rapid, dose dependent, and independent of cell type. (A) Confluent NIH-3T3 cells were trypsinized and pelleted via centrifugation for 5 min at 100 × g, 4°C. The cell pellets were resuspended in concentrations of FITC-labeled, 50-kDa mean molecular mass poly-L-lysine between 0 and 100 μg/ml, then incubated at 37°C on a rotary shaker. After 1 h, the cells were pelleted, washed with 1% FBS/PBS, resuspended in ice-cold 1% FBS/PBS, and analyzed via flow cytometry. (B) NIH-3T3 cells prepared as described above were exposed to 40 μg/ml 50-kDa mean molecular mass PLL for various times then analyzed via flow cytometry. (C) Confluent NIH-3T3 (solid circles) and CHO (open circles) cells prepared as described above were exposed to various concentrations of 50-kDa mean molecular mass poly-L-lysine for 1 h, then analyzed via flow cytometry.
To test whether there was a difference in the dynamics of PLL adsorption between cell types used in previous adsorption experiments, CHO and NIH-3T3 cells were incubated with concentrations of FITC-PLL between 0 and 100 μg/ml for 1 h at 37°C, washed, and analyzed via flow cytometry (Fig. 4 C). Despite differences in their expression of virus receptor proteins on their cell surfaces, the CHO and NIH-3T3 cells bound the PLL identically, suggesting that the cationic polymer is interacting with a more fundamental component of the cell membrane. Given direct evidence of cationic polymer adsorption to cells and their putative role in electrostatic shielding, we then determined whether anionic polymers would reverse the effect.
Anionic polymers inhibit the adsorption of cationic polymers on target cell surfaces
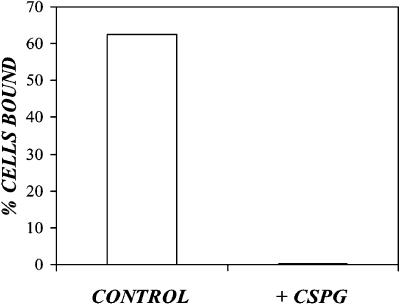
To determine whether anionic polymers inhibit adsorption and transduction via interference with the cell-cationic polymer interaction, we measured PLL adsorption in the presence of transduction inhibiting concentrations of the anionic polymer, chondroitin sulfate proteoglycan. NIH-3T3 cells were pelleted and resuspended in FBS/PBS with 40 μg/ml FITC-PLL or 40 μg/ml FITC-PLL plus 40 μg/ml chondroitin sulfate proteoglycan. After a 1-h incubation at 37°C, the cells were pelleted, washed, and analyzed via flow cytometry (Fig. 5). The presence of the negatively charged, chondroitin sulfate proteoglycan, completely eliminated PLL adsorption to the cell surface.
FIGURE 5.
Chondroitin sulfate proteoglycan abolishes FITC-labeled poly-L-lysine adsorption to target cells. Confluent NIH-3T3 cells were trypsinized and pelleted via centrifugation for 5 min at 100 × g, 4°C. The cell pellets were resuspended in 1% FBS/PBS containing 40 μg/ml FITC-labeled poly-L-lysine (open bars) or 40 μg/ml poly-L-lysine plus 40 μg/ml chondroitin sulfate proteoglycan (solid bars), then incubated at 37°C on a rotary shaker. After 1 h, the cells were pelleted, washed with 1% FBS/PBS, resuspended in ice-cold 1% FBS/PBS, and analyzed via flow cytometry.
Cationic polymers reduce the negative potential on the cell and virus
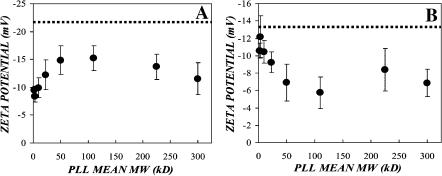
To study the effect of cationic polymers on the surface potential of the virus and cell, we measured the ζ-potential of each after incubation with polybrene and the various poly-L-lysines. Confluent NIH-3T3 cells were trypsinized and pelleted via centrifugation at 100 × g for 5 min, 4°C. The cell pellet was resuspended in isotonic PBS and 106 cells were placed into a cuvette containing 2 ml isotonic PBS with optimal transduction enhancing concentrations of the cationic polymers (i.e., 4 μg/ml for the high molecular mass PLLs, 8 μg/ml for 4–15-kDa PLL, 64 μg/ml for 1–4-kDa PLL, and 5 μg/ml for polybrene). After incubation for 2 h at 37°C, the ζ-potential of the cells was measured via phase analysis light scattering using a ZetaPALS instrument (Fig. 6 A). Control NIH-3T3 cells exhibited a ζ-potential of −21.73 ± 1.08 mV. The presence of cationic polymers reduced the magnitude of the cell surface ζ-potential by between 30% and 60% (Table 2). The greatest cell surface charge neutralization appears for low molecular mass PLLs (2.5–9.5 kDa) with the charge reduction being a minimum for molecular masses between 50 kDa and 110 kDa. This is possibly a result of repulsive steric entropic effects between the larger cationic polymer and the cell polysaccharide layer. Interestingly, this effect appears to be reversed for virus charge neutralization with PLL.
FIGURE 6.
Cationic polymers neutralize the negative ζ-potential on the virus and target cell. (A) Confluent NIH-3T3 cells were trypsinized and pelleted via centrifugation at 100 × g for 5 min, 4°C. The cell pellet was resuspended in isotonic PBS and 106 cells were placed into a cuvette containing 2 ml isotonic PBS. The cell suspension was supplemented with optimal transduction enhancing concentrations of the various cationic polymers (i.e., poly-L-lysine and polybrene), and was incubated at 37°C. After 2 h, the ζ-potential of the cells was measured via phase analysis light scattering using a ZetaPALS instrument. The dashed line represents the baseline cell surface ζ-potential of −21.73 ± 1.08 mV. (B) Ecotropic virus was pelleted via ultracentrifugation for 1.5 h, at 275,000 × g, 4°C. The virus pellet was resuspended in isotonic PBS at one-tenth the original volume, and 20 μl was added to a ZetaPALS cuvette containing 2 ml isotonic PBS. The virus suspension was supplemented with optimal transduction enhancing concentrations of the various cationic polymers (i.e., poly-L-lysine and polybrene), and was incubated at 37°C. After 2 h, the ζ-potential of the cells was measured via phase analysis light scattering using a ZetaPALS instrument. The dashed line represents the baseline virus surface ζ-potential of −13.24 ± 0.68 mV.
TABLE 2.
Effect of cationic polymers on NIH-3T3 ζ-potential
| Mean molecular mass (kDa) | ζ-Potential (mV) | % neutralization | |
|---|---|---|---|
| Control | 0 | −21.73 ± 1.08 | N/A |
| PLL 1–4 kDa (64 μg/ml) | 2.5 | −9.47 ± 0.76 | 56.4% |
| Polybrene (8 μg/ml) | 3.6 | −8.39 ± 0.992 | 61.4% |
| PLL 4–15 kDa (8 μg/ml) | 9.5 | −9.91 ± 1.76 | 54.4% |
| PLL 15–30 kDa (4 μg/ml) | 22.5 | −12.24 ± 2.66 | 43.7% |
| PLL 30–70 kDa (4 μg/ml) | 50 | −14.85 ± 2.56 | 31.7% |
| PLL 70–150 kDa (4 μg/ml) | 110 | −15.19 ± 2.23 | 30.1% |
| PLL 150–300 kDa (4 μg/ml) | 225 | −13.66 ± 2.3 | 37.1% |
| PLL >300 kDa (4 μg/ml) | 300 | −11.53 ± 2.84 | 46.9% |
To measure the effect of the polymers on the virus ζ-potential, ecotropic virus was pelleted via ultracentrifugation for 1.5 h, at 275,000 × g, 4°C. The virus pellet was resuspended in isotonic PBS at one-tenth the original volume, and 20 μl was added to a ZetaPALS cuvette containing 2 ml isotonic PBS. The virus suspension was supplemented with optimal transduction enhancing concentrations of the various cationic polymers and was incubated at 37°C. After 2 h, the ζ-potential of the virus was measured using the ZetaPALS instrument (Fig. 6 B). A control sample of ecotropic virus yielded a ζ-potential of −13.24 ± 0.68 mV. When treated with the cationic polymers, the magnitude of the virus ζ-potential was diminished by between 7% and 60% (Table 3), with an apparent trend toward high molecular weight polymers yielding higher levels of neutralization. This is opposite to the effect observed for cell charge neutralization and may be due to an absence of a repulsive steric entropic hindrance force in the interaction between virus surface and PLL. Further investigation is required to establish the significance and possible mechanisms for these trends.
TABLE 3.
Effect of cationic polymers on virus ζ-potential
| Mean molecular mass (kDa) | ζ-Potential (mV) | % neutralization | |
|---|---|---|---|
| Control | N/A | −13.24 ± 0.68 | N/A |
| PLL 1–4 kDa (64 μg/ml) | 2.5 | −10.57 ± 0.87 | 20.2% |
| Polybrene (8 μg/ml) | 3.6 | −12.19 ± 2.4 | 7.9% |
| PLL 4–15 kDa (8 μg/ml) | 9.5 | −10.45 ± 1.31 | 21.1% |
| PLL 15–30 kDa (4 μg/ml) | 22.5 | −9.23 ± 1.18 | 30.3% |
| PLL 30–70 kDa (4 μg/ml) | 50 | −6.92 ± 2.12 | 47.7% |
| PLL 70–150 kDa (4 μg/ml) | 110 | −5.73 ± 1.84 | 56.7% |
| PLL 150–300 kDa (4 μg/ml) | 225 | −8.37 ± 2.43 | 36.8% |
| PLL >300 kDa (4 μg/ml) | 300 | −6.86 ± 1.57 | 48.2% |
Only incubation with high molecular mass polymers (i.e., >15 kDa) resulted in statistically significant reductions in the virus ζ-potential, with neutralization levels of 30–60% (Table 3). Coupled with the observed charged polymer effects on virus adsorption and transduction, the reductions in virus and cell surface potential mediated by these cationic polymers suggests that charge shielding does play a role in cationic polymer enhancement of transduction and adsorption.
Although these findings provide strong support for the charge shielding hypothesis, they cannot explain all the phenomena observed in the transduction and adsorption experiments shown in Figs. 1–3. There is a strong size dependence on the ability of the polymers to enhance transduction and adsorption, which is most evident when the adsorption and transduction of virus stocks supplemented with equivalent concentrations of polymer were measured. Addition of equivalent masses of cationic polymer implies the addition of equivalent amounts of net charge as shown in Table 1. If charge neutralization were the only mechanism at work, equal concentrations of neutralizing charge would be expected to yield equal levels of neutralization, and by extension, equivalent levels of adsorption and transduction enhancement. As illustrated in Fig. 3, addition of equivalent amounts of charge do not yield equivalent results for transduction or adsorption, necessitating an alternative explanation for the increased efficiency of the high molecular weight polymers.
Cationic polymer aggregation of virus particles is polymer size dependent
The relationship between virus diameter and transport was investigated theoretically using a previously detailed treatment (Berg and Purcell, 1977). We calculated the sedimentation velocity of a single virus to be 1.3 nm/s using  where the virus radius is 50 nm, the density difference between the virus and the medium (ρs − ρ) is 0.16 g/cm3, g = 980 cm/s2, and the medium viscosity (η) is 6.5 × 10⁻³ g/cm/s. To compare this with the relative velocity of diffusion we defined a characteristic diffusion time (τd) as the half-life of virus bioactivity, 7.5 h (Le Doux et al., 1999a), and calculated the characteristic diffusion length (Ld) as 433.5 μm using
  where the virus diffusivity (D) is 1.74 × 10⁻⁸ cm2/s (Bajaj et al., 2001). Thus, the relative velocity of diffusion is 16.1 nm/s. For sedimentation to be on the same scale as diffusive virus transport to the cell monolayer, therefore, the effective virus radius would have to increase by at least 3.5-fold, as sedimentation velocity varies with the square of the radius. This assumes that the density of the aggregate is the same as that of the virus and this depends on the aggregate's structure.
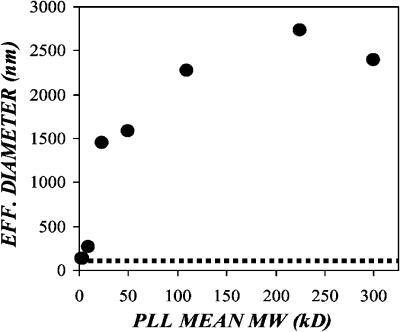
To determine whether cationic polymer enhancement of adsorption could be due to aggregation and sedimentation of the virus particles, we measured the effective diameter of the virus in the presence of polybrene and the various poly-L-lysines. Ecotropic retrovirus was concentrated via ultracentrifugation at 275,000 × g for 1.5 h at 4°C, and the resulting virus pellet was resuspended in isotonic PBS at one-tenth the original volume. The concentrated virus was divided into aliquots and supplemented with optimal transduction enhancing concentrations of the cationic polymers (i.e., 4 μg/ml for the high molecular mass PLLs, 8 μg/ml for 4–15-kDa PLL, 64 μg/ml for 1–4-kDa PLL, and 5 μg/ml for polybrene). The virus-polymer mixtures were incubated at 37°C for 1 h, then the effective particle diameter was measured via laser light scattering in a ZetaPALS instrument (Fig. 7). The control sample of virus yielded an effective virus diameter of 101.6 nm, in agreement with estimates of virus diameter made via electron microscopy (Coffin et al., 1997). The low molecular mass polymers (i.e., 1–4-kDa PLL, 4–15-kDa PLL and polybrene) resulted in very low levels of virus aggregation, yielding a maximal threefold increase in the effective particle diameter. The high molecular weight PLLs, however, caused relatively high levels of virus aggregation, with from 15- to 20-fold increases in effective particle diameter (Table 4). This is consistent with our theoretical determination of the minimal increase in particle radius for virus sedimentation due to gravity to be on par with virus diffusion. Before aggregation we predicted that the diffusional velocity was roughly 16-fold greater than the sedimentation velocity. Assuming no decrease in aggregate density compared to the virus itself, a fourfold increase in effective diameter (from 100 to 400 nm) would be sufficient to balance the diffusional and sedimentation velocities.
FIGURE 7.
Cationic polymer-mediated aggregation of retrovirus particles is size dependent. Ecotropic retrovirus was concentrated via ultracentrifugation at 275,000 × g for 1.5 h at 4°C, and the resulting virus pellet was resuspended in one-tenth the original volume of isotonic PBS. The concentrated virus was supplemented with optimal transduction enhancing concentrations of the cationic polymers (poly-L-lysine and polybrene) and incubated at 37°C for 1 h. The effective particle diameter was measured via laser light scattering in a ZetaPALS instrument. The dashed line represents the diameter of an untreated virus sample (101.3 nm).
TABLE 4.
Effect of cationic polymers on virus aggregation state
| Mean molecular mass (kDa) | Particle diameter (nm) | Fold increase | |
|---|---|---|---|
| Control | 0 | 101.3 | N/A |
| PLL 1–4 kDa (64 μg/ml) | 2.5 | 129.5 | 1.3 |
| Polybrene (8 μg/ml) | 3.6 | 131.7 | 1.3 |
| PLL 4–15 kDa (8 μg/ml) | 9.5 | 260.1 | 2.6 |
| PLL 15–30 kDa (4 μg/ml) | 22.5 | 1452.4 | 14.3 |
| PLL 30–70 kDa (4 μg/ml) | 50 | 1584.9 | 15.6 |
| PLL 70–150 kDa (4 μg/ml) | 110 | 2274.3 | 22.5 |
| PLL 150–300 kDa (4 μg/ml) | 225 | 2739.3 | 27.0 |
| PLL >300 kDa (4 μg/ml) | 300 | 2389.9 | 23.4 |
Interestingly, there was a size-dependent increase in the extent of aggregation amongst the low molecular weight PLLs; however, the high molecular weight PLLs resulted in similar levels of aggregation, despite further increases in size. This was consistent with the transduction and adsorption observations and likely reflects a transition from diffusion to sedimentation dominated virus transport. Low molecular mass (<15 kDa) polymers resulted in only modest increases in the effective virus diameter; however, all of the increases were threefold or less (Table 4). Conversely, the high molecular mass (>15 kDa) polymers all resulted in dramatic increases in the effective virus diameter that were severalfold higher than the threshold necessary to balance diffusional and sedimentation velocities. Thus the ability of high molecular weight polymers to enhance virus adsorption and transduction via a combination of charge shielding and virus aggregation results in greater efficiency of enhancement as compared to low molecular weight polymers, which are limited to charge shielding.
CONCLUSIONS
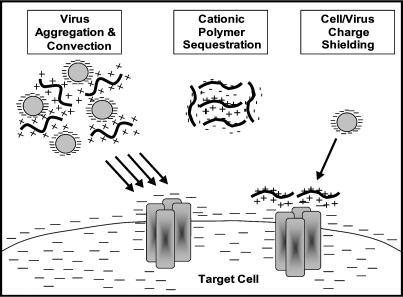
In light of the findings described here, we propose a revised physical model of virus transport. In this model, electrostatic interactions between the virus, target cell, and charged polymers determine the nature and magnitude of the driving force for virus adsorption (Fig. 8). For low molecular weight cationic polymers, charge shielding is their mechanism of enhancement, and once sufficient virus and cell charge neutralization has been achieved, adsorption can occur readily. Large molecular weight polymers can effect the electrostatics of the virus-cell interaction similarly; however, they have the added ability to aggregate virus sufficiently to enhance adsorption via sedimentation. Anionic polymers, on the other hand, inhibit the processes of adsorption and transduction via sequestration of cationic polymers, preventing charge shielding and virus aggregation.
FIGURE 8.
A revised physical model of retrovirus transport. Electrostatic interactions among the virus, target cell, and charged polymers determine the nature and magnitude of the driving force for virus adsorption. All cationic polymers are capable of enhancing adsorption via neutralization of negative cell and virus surface charges; however, only large molecular weight polymers can aggregate virus sufficiently to enhance adsorption via sedimentation. Anionic polymers inhibit the processes of adsorption and transduction via sequestration of cationic polymers, preventing charge shielding and virus aggregation.
Although it is possible that other models can be consistent with the available data, our revised model has significant implications for the design of improved retroviral gene therapy protocols. Current efforts to evaluate the underlying reason for disappointing transduction efficiency levels on certain cell types has focused primarily on the role of receptor expression levels and other events downstream of virus transport and adsorption in the transduction process. The findings described herein suggest that characterization of the electrostatic properties (i.e., ζ-potential) of the target cells or tissues may suggest instances where insufficient charge neutralization is responsible for the low efficiencies observed. Moreover, selection of an optimal size cationic polymer is important, as not all polymers will yield equivalent enhancement of transduction efficiency. By optimizing the target cell surface and the vector preparation so as to maximize virus transport to the cell surface, significant increases in transduction efficiency can be obtained.
Acknowledgments
This work was supported by grants from the National Institutes of Health (PO1HD 28528-07) (J.R.M.) and the National Science Foundation (BES-9800617) (M.L.Y.). H.E.D. was supported by a Biomedical Engineering Graduate Fellowship from the Whitaker Foundation.
References
- Andreadis, S. T., C. M. Roth, J. M. Le Doux, J. R. Morgan, and M. L. Yarmush. 1999. Large-scale processing of recombinant retroviruses for gene therapy. Biotechnol. Prog. 15:1–11. [DOI] [PubMed] [Google Scholar]
- Andreadis, S., T. Lavery, H. E. Davis, J. M. Le Doux, M. L. Yarmush, and J. R. Morgan. 2000. Toward a more accurate quantitation of the activity of recombinant retroviruses: alternatives to titer and multiplicity of infection. J. Virol. 74:3431–3439. [DOI] [PMC free article] [PubMed] [Google Scholar]
- Bajaj, B., P. Lei, and S. T. Andreadis. 2001. High efficiencies of gene transfer with immobilized recombinant retrovirus: kinetics and optimization. Biotechnol. Prog. 17:587–596. [DOI] [PubMed] [Google Scholar]
- Berg, H. C., and E. M. Purcell. 1977. Physics of chemoreception. Biophys. J. 20:193–219. [DOI] [PMC free article] [PubMed] [Google Scholar]
- Bukrinskaya, A. G. 1982. Penetration of viral genetic material into host-cell. Adv. Virus Res. 27:141–204. [DOI] [PubMed] [Google Scholar]
- Cavazzana-Calvo, M., S. Hacein-Bey, C. D. Basile, F. Gross, E. Yvon, P. Nusbaum, F. Selz, C. Hue, S. Certain, J. L. Casanova, P. Bousso, F. L. Deist, and A. Fischer. 2000. Gene therapy of human severe combined immunodeficiency (SCID)-X1 disease. Science. 288:669–672. [DOI] [PubMed] [Google Scholar]
- Chuck, A. S., M. F. Clarke, and B. O. Palsson. 1996. Retroviral infection is limited by Brownian motion. Hum. Gene Ther. 7:1527–1534. [DOI] [PubMed] [Google Scholar]
- Coffin, J. M., S. H. Hughes, and H. E. Varmus. 1997. Retroviruses. Cold Spring Harbor Laboratory Press, Cold Spring Harbor, NY. [PubMed]
- Davis, H. E., J. R. Morgan, and M. L. Yarmush. 2002. Polybrene increases retrovirus gene transfer efficiency by enhancing receptor-independent virus adsorption on target cell membranes. Biophys. Chem. 97:159–172. [DOI] [PubMed] [Google Scholar]
- Evans, D. F., and H. Wennerstrom. 1999. The Colloidal Domain: Where Physics, Chemistry, and Biology Meet, 2nd ed. Wiley-VCH, New York.
- Forestell, S. P., E. Bohnlein, and R. J. Rigg. 1995. Retroviral end-point titer is not predictive of gene transfer efficiency: implications for vector production. Gene Ther. 2:723–730. [PubMed] [Google Scholar]
- Hiemenz, P. C., and R. Rajagopalan. 1997. Principles of Colloid and Surface Chemistry, 3rd ed. Marcel Dekker, New York.
- Hunter, R. J. 2001. Foundations of Colloid Science, 2nd ed. Oxford University Press, New York.
- Israelachvili, J. 1992. Intermolecular and Surface Forces, 2nd ed. Academic Press, New York.
- Kadan, M. J., S. Sturm, W. F. Anderson, and M. A. Eglitis. 1992. Detection of receptor-specific murine leukemia virus binding to cells by immunofluorescence analysis. J. Virol. 66:2281–2287. [DOI] [PMC free article] [PubMed] [Google Scholar]
- Lane, D., and E. Harlow. 1988. Antibodies: A Laboratory Manual. Cold Spring Harbor Laboratory, Cold Spring Harbor, NY.
- Le Doux, J. M., H. E. Davis, J. R. Morgan, and M. L. Yarmush. 1999a. Kinetics of retrovirus production and decay. Biotechnol. Bioeng. 63:654–662. [PubMed] [Google Scholar]
- Le Doux, J. M., J. R. Morgan, R. G. Snow, and M. L. Yarmush. 1996. Proteoglycans secreted by packaging cell lines inhibit retrovirus infection. J. Virol. 70:6468–6473. [DOI] [PMC free article] [PubMed] [Google Scholar]
- Le Doux, J. M., J. R. Morgan, and M. L. Yarmush. 1999b. Differential inhibition of retrovirus transduction by proteoglycans and free glycosaminoglycans. Biotechnol. Prog. 15:397–406. [DOI] [PubMed] [Google Scholar]
- Leckband, D., and J. Israelachvili. 2001. Intermolecular forces in biology. Q. Rev. Biophys. 34:105–267. [DOI] [PubMed] [Google Scholar]
- Morgan, J. R., J. M. LeDoux, R. G. Snow, R. G. Tompkins, and M. L. Yarmush. 1995. Retrovirus infection: effect of time and target cell number. J. Virol. 69:6994–7000. [DOI] [PMC free article] [PubMed] [Google Scholar]
- Myers, D. 1999. Surfaces, Interfaces, and Colloids: Principles and Applications, 2nd ed. Wiley-VCH, New York.
- Pizzato, M., S. A. Marlow, E. D. Blair, and Y. Takeuchi. 1999. Initial binding of murine leukemia virus particles to cells does not require specific Env-receptor interaction. J. Virol. 73:8599–8611. [DOI] [PMC free article] [PubMed] [Google Scholar]
- Roth, C. M., and M. L. Yarmush. 1999. Nucleic acid biotechnolqgy. Annu. Rev. Biomed. Eng. 1:265–297. [DOI] [PubMed] [Google Scholar]
- Russel, W. B., D. A. Saville, and W. R. Schowalter. 1989. Colloidal Dispersions, 1st ed. G. K. Batchelor, editor. Cambridge University Press, Cambridge, UK.
- Tardieu, M., R. L. Epstein, and H. L. Weiner. 1982. Interaction of viruses with cell-surface receptors. Int. Rev. Cytol. 80:27–61. [DOI] [PMC free article] [PubMed] [Google Scholar]
- Wickham, T. J., R. R. Granados, H. A. Wood, D. A. Hammer, and M. L. Shuler. 1990. General analysis of receptor-mediated viral attachment to cell surfaces. Biophys. J. 58:1501–1516. [DOI] [PMC free article] [PubMed] [Google Scholar]
- Yang, Y. W., and J. C. Yang. 1996. Effect of polyionic compounds on the adsorption of polyoma virus. Antiviral Res. 33:33–39. [DOI] [PubMed] [Google Scholar]
- Yu, H., N. Soong, and W. F. Anderson. 1995. Binding kinetics of ecotropic (Moloney) murine leukemia retrovirus with NIH 3T3 cells. J. Virol. 69:6557–6562. [DOI] [PMC free article] [PubMed] [Google Scholar]


