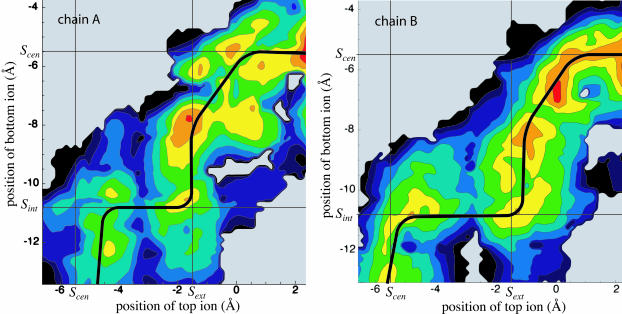
FIGURE 3.
Potential of mean force for both pores (chains A and B) of ClC as a function of the positions along the Z axis of the top and bottom Cl− ions. Contours represent slices of 1 kcal/mol at a spatial resolution of 0.15 Å. Red indicates a low energy whereas blue denotes high energy. The shaded background denotes areas not sampled and the solid black contour represents energies above a threshold. The position of the three Cl− binding sites from the x-ray structure of Dutzler et al. (2003) are identified by straight lines. The minimum energy path, corresponding to the most likely conduction pathway, is shown for each pore as a thick black line.

