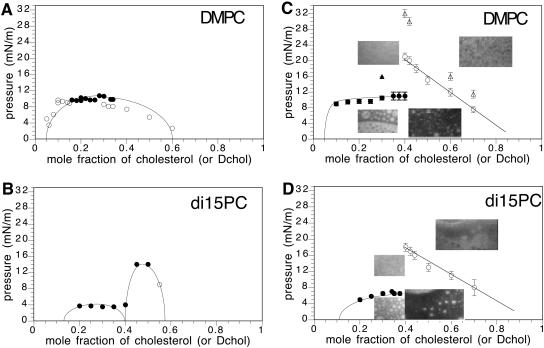
FIGURE 4.
Experimental pressure-composition phase diagrams. (A) DMPC/Dchol (or cholesterol), 0.06–2 mol % Texas Red DHPE probe for Dchol <40 mol %. One mol % NBD probe was used to visualize mixtures at 40 and higher mol % Dchol. The solid circles mark transitions having domain shape fluctuations. The unfilled circles mark transition pressures without shape fluctuations. (B) DiC15PC/Dchol (or cholesterol), 0.4 mol % Texas Red DHPE. A and B are taken from Keller et al. (2000). (C) DMPC/Dchol, 2 mol % Texas Red DHPE probe. The micrograph inserts on the left side of the figure are for a 30-mol % Dchol mixture above and below the critical pressure. Note that (upper left) the membrane is homogeneous above the critical pressure, and (lower left) the membrane is heterogeneous below the critical pressure, showing white domains on a black background, as well as black domains on a white background, as expected for a critical composition. (The α-critical composition is ∼30 mol % Dchol.) The micrographs on the right side are of a 50 mol % Dchol mixture above (upper right) and below (lower right) the contrast inversion pressure. The unfilled circles denote the contrast inversion pressure. When the subphase is PBS, the solid triangle marks the α-critical pressure and the open triangles mark the β-contrast inversion pressures. (D) DiC15PC/Dchol, 2 mol % Texas Red DHPE probe. Micrographs on the left side of the figure refer to a 30-mol % Dchol mixture below and above the transition pressure. Micrographs on the right side refer to 50-mol % Dchol mixture below and above the contrast inversion pressure. The α-critical composition is ∼35 mol % Dchol. The unfilled circles denote the contrast inversion pressure.

