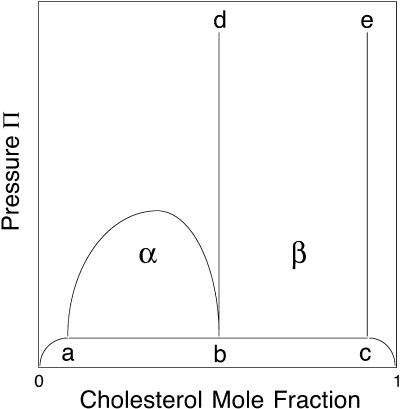
FIGURE 8.
Schematic phase diagram showing two two-phase fields, α and β. The triple point line a-b-c has not been seen experimentally. Contrast inversion is seen in the β-two-phase region. The composition of the phase boundary e–c is likely to be close to that of pure Dchol. The phase boundary d–b lies close to the cusp composition.

