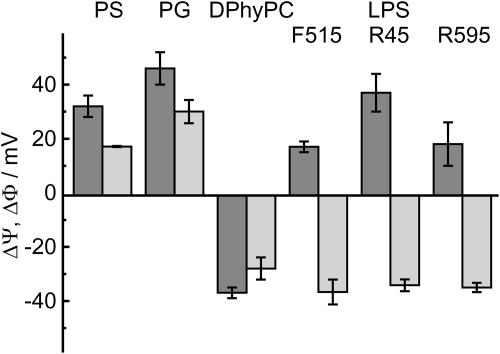
FIGURE 4.
Comparison of the inner membrane potential differences ΔΦ (light gray bars) determined by carrier transport measurements and ΔΨ by IFC measurements (dark gray bars), respectively, for asymmetric membrane, composed of different phospholipids or lipopolysaccharides. In the figure only one leaflet is defined, the other one was from PL in all cases. The PL side consists of 81 mol % PE, 17 mol % PG, and 2 mol % DPG. Measurements were performed at 37°C in electrolyte solution containing 100 mM KCl and 5 mM MgCl2 buffered with 5 mM HEPES and adjusted to pH 7.

