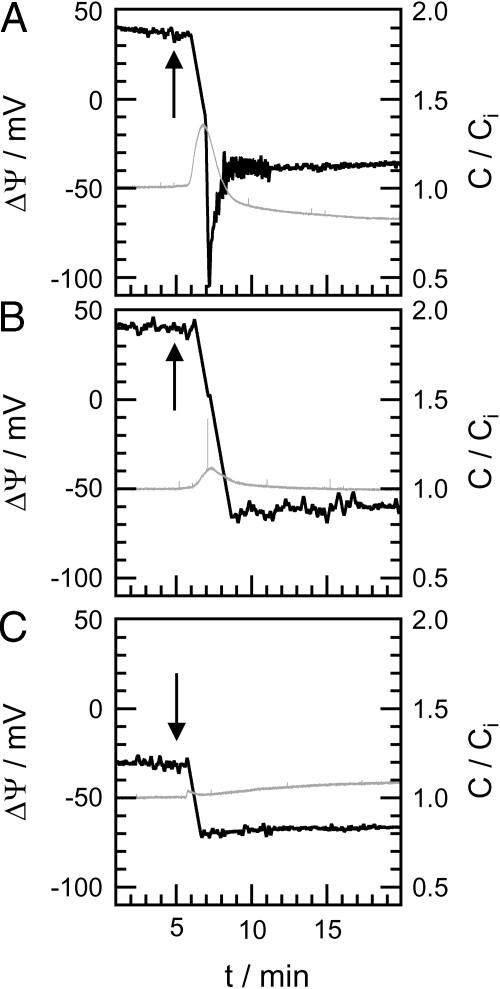
FIGURE 5.
Change of the capacitance (gray traces) and of the inner membrane potential difference ΔΨ (black traces) of different membranes after addition of rCAP18106–137. Peptide was added 5 min after membrane preparation (arrow): LPS F515/PL (A), LPS R45/PL (B), and DPhyPC/PL (C). Composition of PL side and electrolyte solution as described for Fig. 4.

