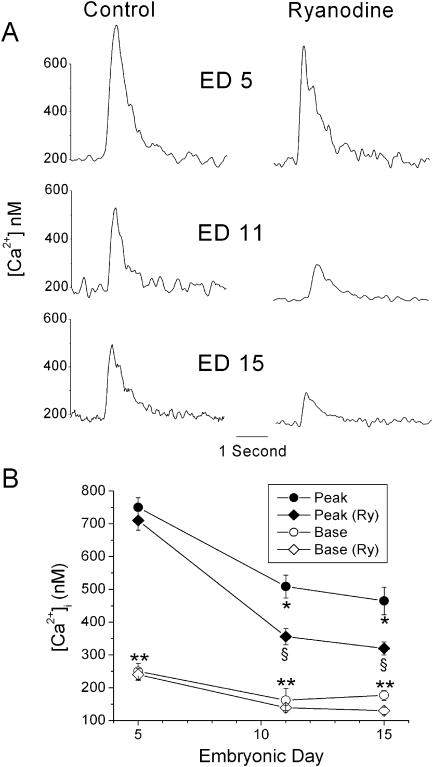
FIGURE 1.
The effect of ryanodine (Ry) on electrically stimulated intracellular Ca2+ transients during development. (A) Examples of Ca2+ transients illustrating the effects before and after the addition of 100 μM ryanodine. Note that Ca2+ transients are larger at ED5 compared to ED11 and 15, whereas the effect of ryanodine is smaller. (B) Graphical representation illustrating that most of the decline in the magnitude of Ca2+ transients as well as the largest increase in the effect of ryanodine occurs between ED5 and 11. Peak indicates the peak magnitude of the Ca2+ transient and base indicates the baseline Ca2+ level after decay of the Ca2+ transient and just before the beginning of the next transient. N = 7 myocytes for each of the three ages. The data points represent 2–3 experiments per age with 2–4 myocytes per experiment. Error bars indicate mean ± SE. Single asterisk (*) indicates statistical significance when comparing either ED11 or 15 with ED5. Section symbol (§) indicates significant reduction in the peak after ryanodine treatment in paired comparisons with the student's t-test. Double asterisk (**) indicates that the baseline was significantly less after ryanodine treatment when compared using the paired student's t-test.

