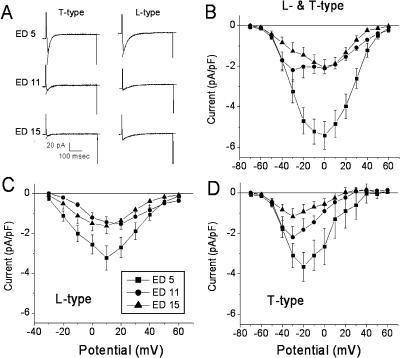
FIGURE 2.
Examples of L- and T-type Ca2+ currents and current-voltage (I-V) relationships from ED5, 11, and 15. (A) Example of current traces illustrating T-type Ca2+ current elicited from steps to −30 mV from the holding potential of −80 mV and L-type current from a step to +10 mV after a prepulse to −40 mV to inactivate the T-current. Note that the Ca2+ currents are largest at ED5. The overlying smooth curves illustrate the single-exponential fits to the decaying phase of the currents. (B) I-V curves elicited by voltage steps from a −80-mV holding potential showing the peak values for inward Ca2+ currents. The biphasic I-V curve most noticeable at ED11 is due to the presence of T-type Ca2+ current which activates at a lower threshold compared to L-type current (see text). (C) I-V relationships for L-type Ca2+ current elicited after inactivation of T-type current with a 500-ms prepulse to −40 mV. (D) The I-V relationship for T-type current was determined by subtracting the values illustrated in C from those in B. N = 15, 10, and 15 for ED5, 11, and 15, respectively, and 3–5 cells per experiment. Error bars indicate mean ± SE.

