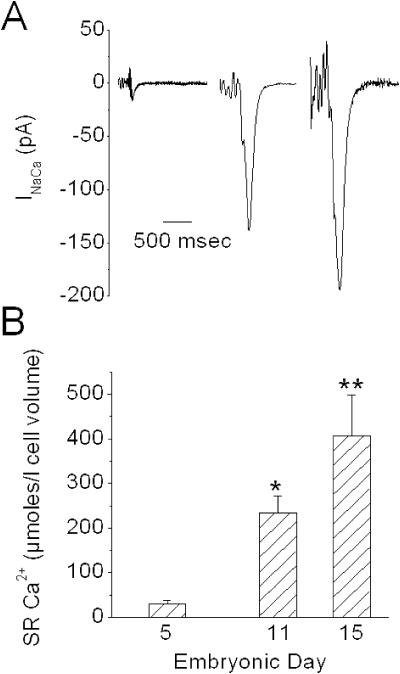
FIGURE 3.
SR Ca2+ content determined from integration of the Na+/Ca2+ exchange current after caffeine application. A shows an example of the exchanger current after caffeine application to a ventricular myocyte from ED5, 11, and 15 (left to right, respectively). The noisy baseline before the caffeine-induced current was due to the experimenter placing his hand and arm within the Faraday cage and close to the patch-amplifier head stage during the caffeine addition. The seal remained stable throughout this process. N = 5, 6, and 6, for ED5, 11, and 15, respectively, and representing two experiments per age and 2–3 cells per experiment. (B) Graphical representation of SR Ca2+ content. Single asterisk (*) indicates that ED11 SR content is significantly greater compared to ED5. Double asterisk (**) indicates significance when comparing ED15 with either ED5 or 11. Bars indicate mean ± SE.

