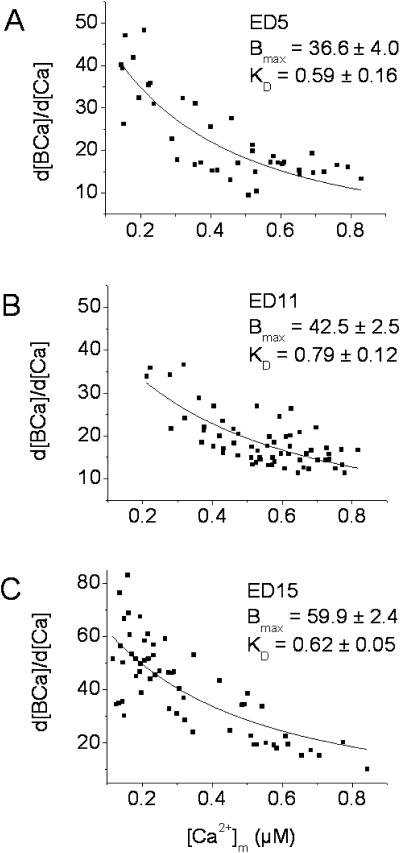
FIGURE 5.
Cytosolic Ca buffering. [Ca2+]m and d[BCa]/d[Ca] were calculated and fitted to Eq. 2 as described in the text. The KD and Bmax (mean ± SE) for each age are shown in A–C, and were determined by fitting the data set for each myocyte individually. The cumulative data for each age is shown in the graphs. Note that d[BCa]/d[Ca] is the chord buffer power for any given level of cytosolic-free Ca2+. N = 5, 8, and 8, for ED5, 11, and 15, respectively. The data are from four experiments for each age and 1–3 cells per experiment. Units of Bmax are in μM/liter cell water and KD values are in μM.

