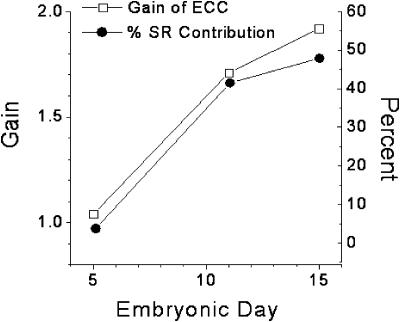
FIGURE 6.
Computed gain factor for CICR and percent contribution to the Ca2+ transient from the SR are illustrated together for comparison. The values were calculated using the Ca2+ buffer power and the data from the field-stimulated Ca2+ transients illustrated in Fig. 1 as detailed in the text. The increase in gain and SR contribution parallels the structural development of SR junctions as demonstrated in Protasi et al. (1996; compare this Fig. 6 with their Fig. 4).

