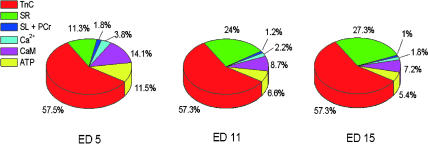
FIGURE 8.
Graphical representation of the proportion of Ca2+ bound by the major cytoplasmic fast Ca2+ binding moieties at the peak of the intracellular Ca2+ transient at the three developmental ages. Note that TnC binds ∼57% of the Ca2+ at each age. The proportion of Ca2+ bound by the SR increases, and this is offset primarily by corresponding decreases in Ca2+ bound by calmodulin and ATP. Ca2+ binding to total sarcolemmal (SL) sites and to creatine phosphate (PCr) is small and has been combined in the figure.

