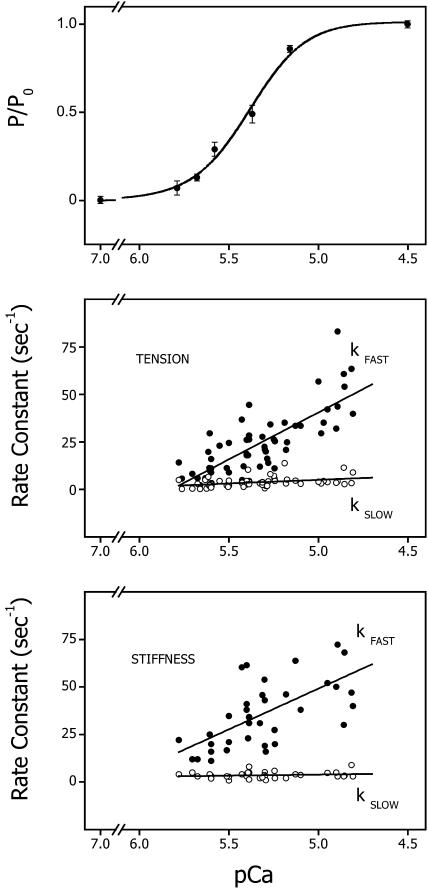
FIGURE 5.
Steady-state tension and the observed rates for the rise in stiffness and tension plotted as a function of pCa. (Upper panel) The average pCa-tension relation for trabeculae used in this study. The data are expressed as means ± SE. The line is a fit by a modified Hill equation (see Eq. 2). The data are best fit with n = 2.76 and pCa50% = 5.39. (Middle panel) The rate of the two components of the tension time course after activation by laser photolysis of NP-EGTA plotted as a function of the pCa produced by photolysis of NP-EGTA. The lines were fit by the method of least squares and are described by the following expression: y = 286 − 49x, r = 0.77 and y = 24 − 3.8x, r = 0.39, respectively, for kfast and kslow, from 58 determinations on 25 trabeculae. The free [Ca2+] was estimated from the pCa-tension relation for each trabecula as described in the text and Fig. 1. (Lower panel) The rate of the two components of the stiffness rise plotted as a function of the pCa produced by photolysis of NP-EGTA. The lines were fit by the method of least squares and are described by the following expression: y = 263 − 43x, r = 0.65 and y = 9 − 1x, r = 0.18, for kfast and kslow, respectively, from 37 determinations on 13 trabeculae.

