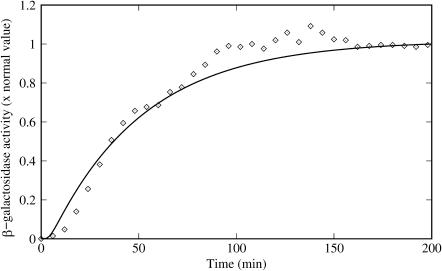
FIGURE 3.
Time evolution of the β-galactosidase activity after an E. coli bacterial culture is changed from a glucose to a lactose growth situation. Comparison of the Knorre (1968) experimental data (diamonds) with the numeric simulation described in the text (solid line).

