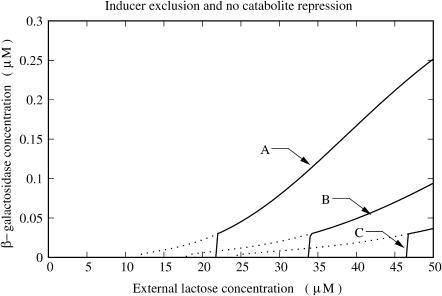
FIGURE 6.
Plots of steady-state β-galactosidase concentration versus external lactose concentration for various values of external glucose concentration ([GE]): (A) [GE] = 0.0 μM; (B) [GE] = 140.0 μM; and (C) [GE] = 280.0 μM. The black and gray lines correspond to the increasing and decreasing external lactose concentration pathways, respectively. The experiments were carried out with the hypothetical mutant strain ncat, in which the cAMP synthesis rate is independent of the extracellular glucose concentration.

