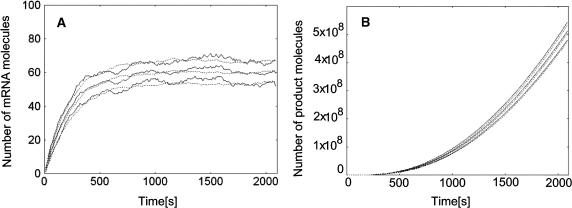
FIGURE 1.
Comparison of the maximal time step method with exact stochastic simulation. Both methods were applied to the benchmark example of a constitutive lactose operon expression described in details elsewhere (Kierzek, 2002). The continuous lines represent the mean and ± 1 SD values computed according to 100 independent simulations with Gillespie algorithm. Dotted lines represent the mean and ± 1 SD time courses obtained with the maximal time step method. (A) The number of mRNA molecules. (B) The number of β-galactosidase reactions (denoted as product). Note that the maximal time step method is able to accurately simulate the trajectories for the chemical species, present in the same reaction environment, with amounts differing by seven orders of magnitude.

