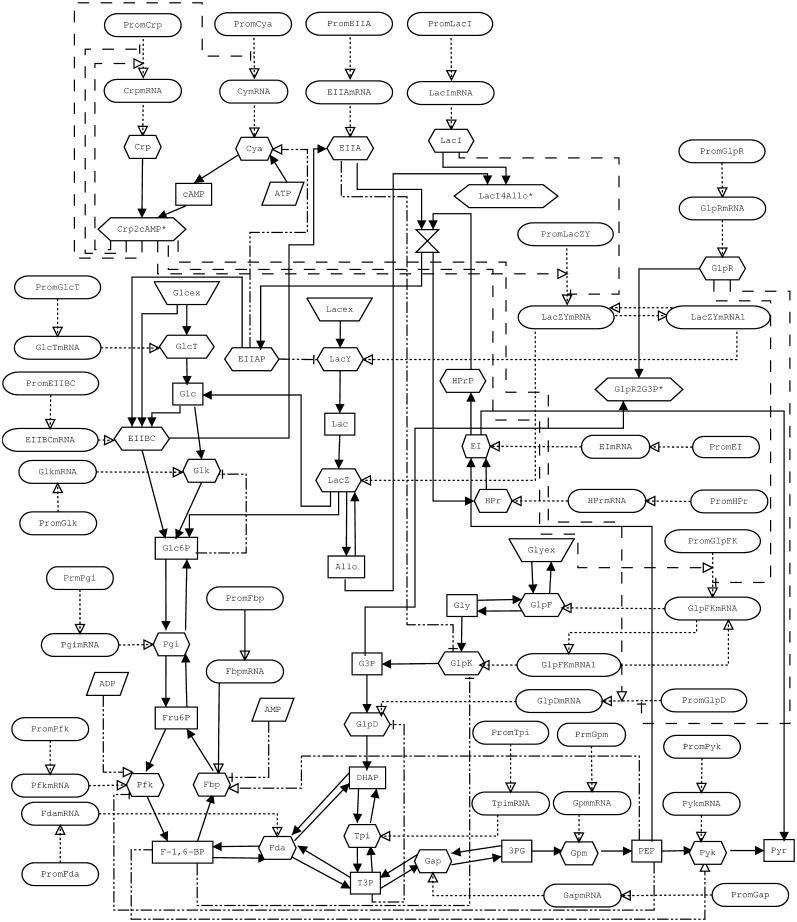
FIGURE 2.
Schema representing the model of E. coli glucose, lactose, and glycerol metabolism used in this work. Nodes represent substances and arrows represent reactions. The node shapes have the following meanings: ellipsoid, DNA and mRNA species; tetragonal, metabolites; hexagonal, enzymes and transporters; trapezoid, external pools of glucose, lactose, and glycerol. The names of the molecular species are explained (see online supplementary material). Different lines denote different reaction classes: metabolic reactions (solid line); protein synthesis (dotted line); transcription regulation (dashed line); and metabolic regulation (dash-dotted line). Color version of the schema is included (see online supplementary material).

