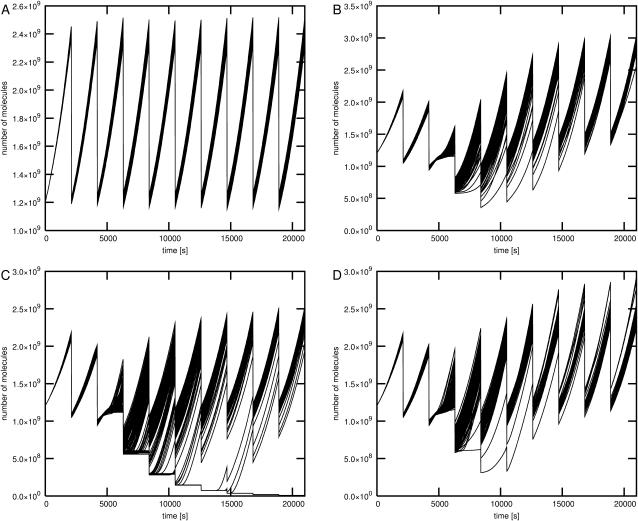
FIGURE 3.
The glycolytic pathway outflow under different conditions. The time courses for 10 bacterial generations are shown. After every generation time of 2100 s the number of all molecules in the system except DNA elements is divided by two and the volume is reset to its initial value. The glycolytic pathway outflow is computed as the number of pyruvate molecules processed by the first order reaction representing the total pyruvate consumption by all metabolic processes in the cell. The rate constant of this reaction was set to 10 1/s following Wang et al. (2001). Four plots represent glycolytic pathway outflow under different conditions. (A) Large number of glucose molecules. The time course shown was obtained in simulation 1 where glucose alone was present. Results for simulations 2, 3, and 4 were nearly identical. (B) Small number of glucose and large number of glycerol molecules. (C) Small number of glucose and large number of lactose molecules. (D) Small number of glucose and large numbers of glycerol and lactose molecules.

