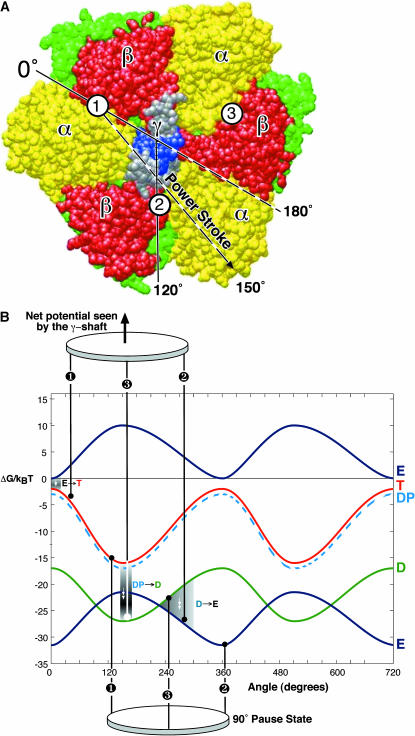
FIGURE 2.
(A) Top view of the F1 hexamer showing the alternating α- and β-subunits encircling the central γ-shaft. The catalytic sites are numbered. Sequential bending of each β-subunit toward a point ∼150° across the diameter drives the rotation of the γ-shaft. (B) The γ-shaft is driven by the coordinated bending of the three β-subunits, each of which could be one of four potentials, one for each occupancy state, VE, VT, VDP, and VD. The total torque is given by the sum of the potentials at the three leg positions spaced 120° apart. The first set of legs shows the system just after ATP binding in site 1 at the beginning of its power-stroke. Site 3 has just released its Pi, site 2 is empty and aiding site 1 during its recoil power-stroke. The second set of legs shows the system at a pause position just before ADP release from site 3. Site 2 is empty and has finished its recoil power-stroke. Site 1 is near the end of its primary power-stroke and contributes a positive driving torque; it is balanced by the negative torque from site 3 in D state. The positive torque from site 1 drives the opening of site 3, which promotes ADP release from site 3. Upon the ADP release from site 3, site 1 finishes its primary power-stroke and drives the system to a position where site 2 waits ATP binding. The separations between the curves corresponds to the experimental conditions: [ATP] = 2 × 10⁻³ M, [ADP] = 1 × 10⁻⁷ M, and [Pi] = 1 × 10⁻⁴ M.

