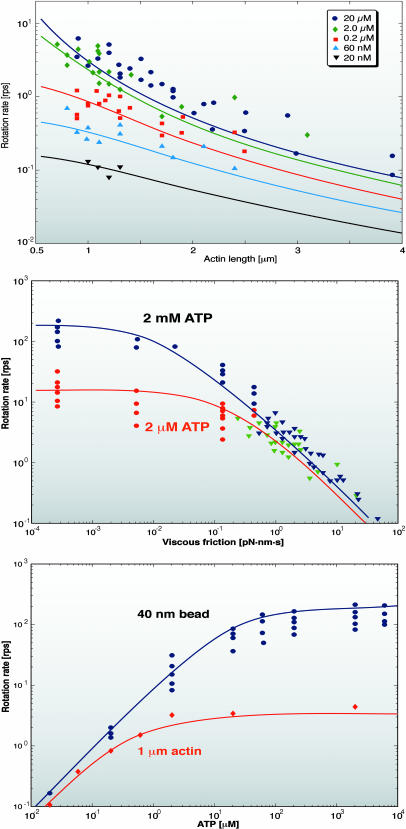
FIGURE 4.
(Top) Model predictions for the actin filament rotation experiments at various ATP concentrations. The theoretical results are the solid lines and the experimental measurements are the symbols. (Lines and symbols of the same color are for the same ATP concentration.) In these experiments the rotational speed is limited by the viscous drag force on the actin filament. (Middle) Nanometer-sized beads have very small drag coefficients, close to the unloaded conditions. The model prediction (solid lines) and the experimental results (symbols) show that the rotational speed saturates to a maximum speed at very small friction coefficients. The rotational speed at these conditions is limited by the kinetics of ATP binding and ADP release. (Bottom) Rotational speed versus ATP concentration for actin (red lines and symbols) and 40-nm beads (blue line and symbols). The lines are model results. The symbols are experimental results. The model correctly predicts the rotational speed over the range of ATP concentrations in experiments.

