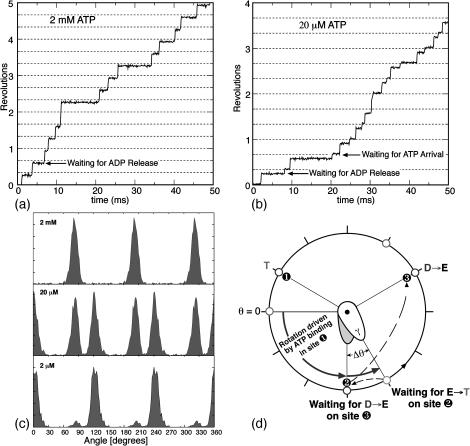
FIGURE 5.
(a) A computed 50-ms time-trace of the angular position of the γ-shaft at 2 mM ATP concentration showing pauses at 90°, 210°, and 330° due to the delay in ADP release from site 3 (see d). (b) Time-trace of the angular position of the γ-shaft at 20 μM ATP. A substep appears at 120° in addition to the pause at 90° that was present at 2 mM ATP. The new pause arises as site 2 awaits a successful ATP binding event (see d). (c) Computed angular histograms of the time-traces at various ATP concentrations reproduce those measured by Yasuda et al. (2001). At 2 mM, one pause is seen at 90°. At 20 mM, two pauses are seen at 90° and 120°. At 2 μM, again only one pause is seen at 120°. (d) A cartoon diagram illustrating the sequence of events that produce the rotational pauses. Define the rotational angle of the γ-shaft measured from θ = 0° as shown. Site 1 waits for ATP binding when γ is at θ = 0° (pause one if ATP concentration is low, circles at 1 and 9 o'clock). Upon ATP binding, the power-stroke of site 1 tries to turn γ to θ = 120°, but it stalls at θ = 90° by the resisting torque (slope of the VD curve in Fig. 2 B) of site 3 with ADP bound (pause two, circles at 2, 6 and 10 o'clock). Upon the ADP release from site 3, site 1 completes its power-stroke to θ = 120°.

