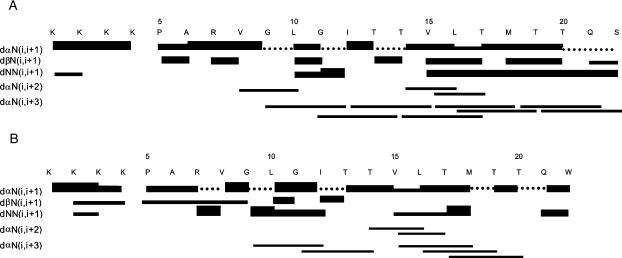
FIGURE 7.
Summary of the 3JHNHα coupling constants and NOE connectivities of NK4-M2GlyR p22 WT (A) and S22W (B) in 40% TFE. The solid circles, just below the amino acid residues, represent the coupling constants that were <6.5 Hz and open circles represent the coupling constants >6.5 Hz. The rest of the coupling constants were not measurable due to the overlapping of signals. Unambiguous sequential and short-range connectivities are shown by lines. The thicknesses of the lines indicate the observed intensity. Dashed lines indicate ambiguity, as a result of overlapping.

