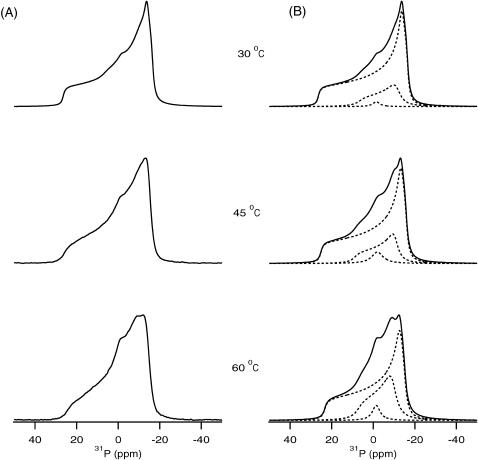
FIGURE 2.
31P NMR spectra of POPC phospholipid bilayers in the presence of 4 mol % PLB with respect to POPC investigated as a function of temperature. (A) Experimental spectra. (B) The dotted-line spectra represent the simulated bilayer species having different vesicle sizes possessing different CSA widths. The solid-line spectra are the sum of the dotted-line spectra and represent the best-fit simulated spectra corresponding to the experimental spectra.

