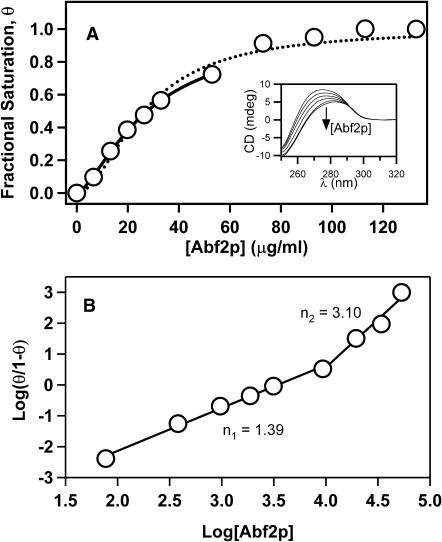
FIGURE 6.
(A) Plot of fraction of bound linearized pBR322 DNA molecules as a function of Abf2p concentration as determined from the CD spectra. Dashed line represents the fit to the whole data set with a cooperative bimolecular binding model. Solid line represents the fit to only the initial region of the Hill plot. Inset shows the CD spectra with an arrow indicating the direction of the spectral change as the protein concentration increases. (B) Hill plot of the data in A.

