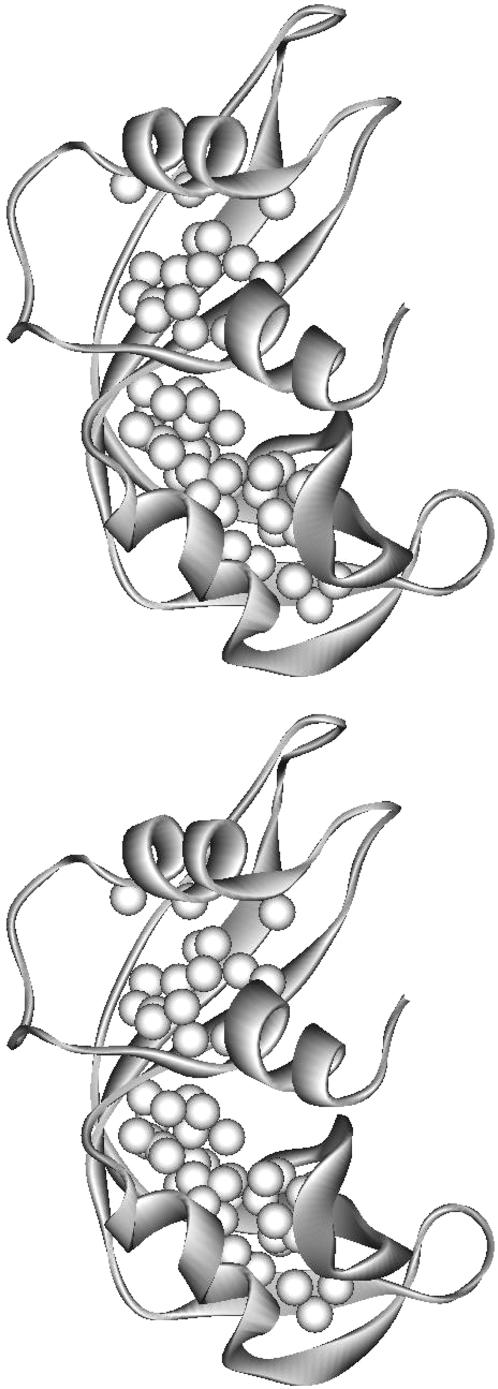
FIGURE 6.
Interior protons relaxation rate differences were measured at depths >6 Å and are indicated as white spheres in the ribbon representation of RNase A. Comparison with Fig. 3, g and h, shows that oxygen-induced relaxation efficiency is not simply correlated with the depth of an interior proton.

