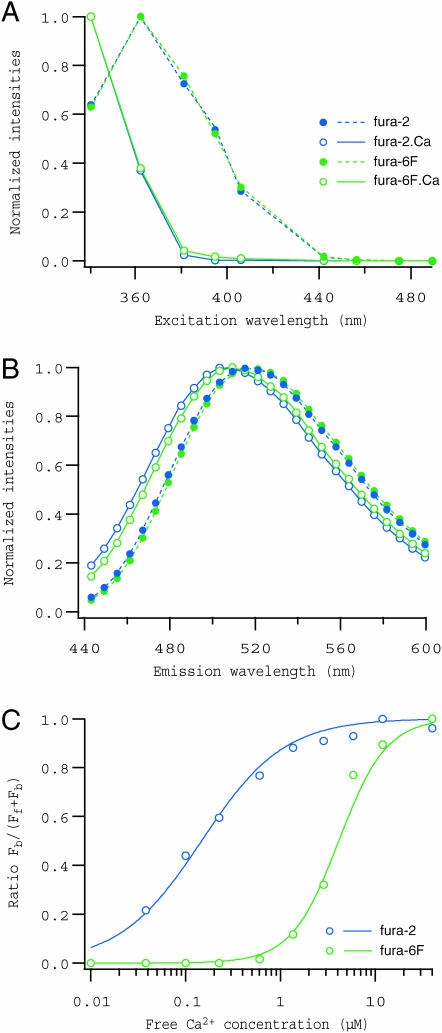
FIGURE 4.
Spectral decomposition of fluorescence from mixtures of fura-2 and fura-6F. Excitation spectra (A), emission spectra (B), and the Ca2+ dependence of ratio Fb/(Ff + Fb) (C) for fura-2 (blue) and fura-6F (green) are shown. A series of spectral data were collected from solutions containing either 5 μM fura-2, 5 μM fura-6F, or both at 10 different free Ca2+ concentrations (0.01, 0.04, 0.10, 0.23, 0.60, 1.4, 2.9, 5.9, 11.9, and 40 μM). Spectra presented by circles in A and B were obtained by PARAFAC modeling performed on all 30 spectral data, and those presented by lines were from data for solutions that contained single indicators only. As in Fig. 3, spectra corresponding to Ca2+-free and -bound forms are represented by filled circles/dashed lines and open circles/solid lines, respectively. Spectral data to be decomposed had a 3-nm bin size, but only every other point in the emission spectra obtained as the solution was plotted in B for clarity. The ratio values plotted against Ca2+ concentration (C) were calculated from the scores for two-indicator solutions (circles) or from those for single indicator solutions (lines).

