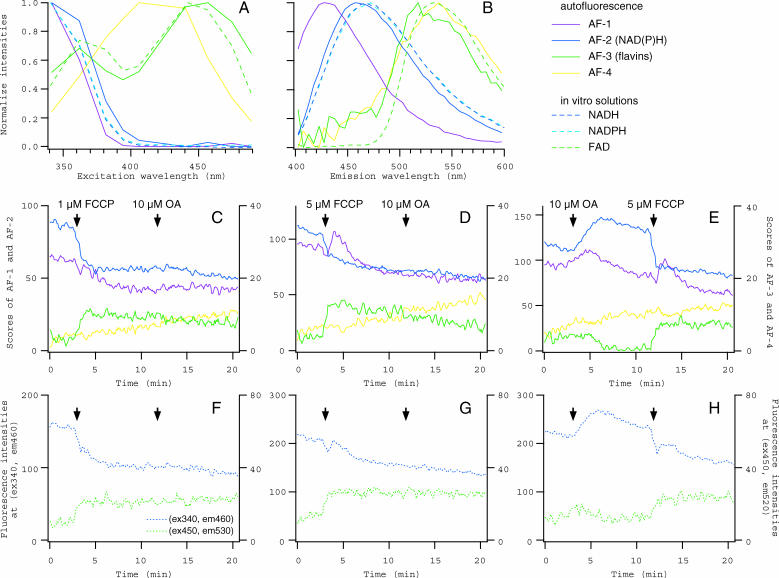
FIGURE 5.
Spectral decomposition of autofluorescence in mouse oocytes. (A and B) Excitation and emission spectra of four autofluorescence components identified in unstained oocytes (from AF-1 to AF-4, solid lines). Spectra obtained from the solutions of NADH, NADPH, and FAD (dashed lines) are also presented for comparison. (C–E) Time courses of changes in the scores for from AF-1 to AF-4 in the oocytes that were exposed successively to FCCP (1 or 5 μM) and OA (10 μM). Scores for AF-1 (purple) and AF-2 (blue) are plotted on the left axis, and those for AF-3 (green) and AF-4 (yellow) are on the right axis. (F–H) Time courses of changes in fluorescence intensities. Intensities in the spectral data from oocytes in C–E were averaged for 460 ± 5 nm emission at 340 nm excitation (blue, on the left axis) and for 530 ± 5 nm emission at 450 nm excitation (green, on the right axis). Time points when the inhibitor was applied were indicated by arrows in C–H.

