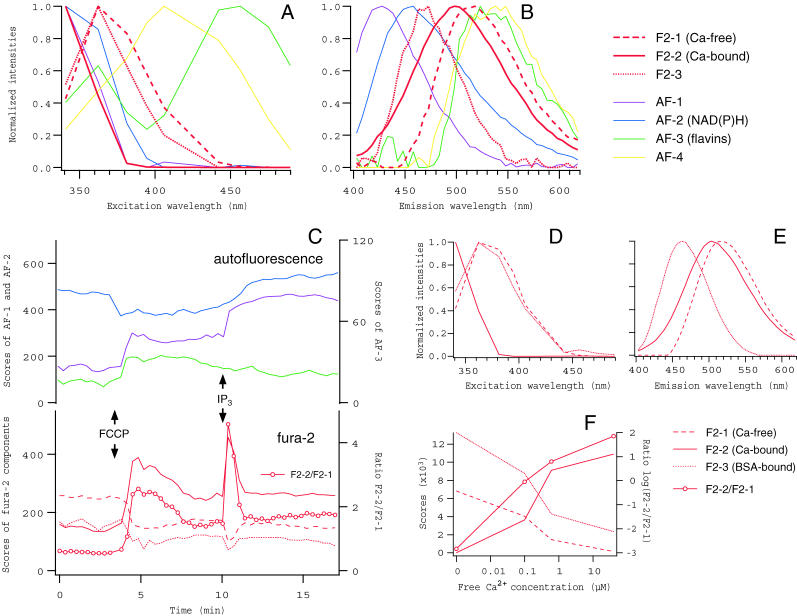
FIGURE 7.
Spectral decomposition of fluorescence from oocytes loaded with fura-2, and from in vitro solution of fura-2 in the presence of BSA. (A–C) Excitation and emission spectra, and the scores of components obtained from fura-2-loaded oocytes. Three components corresponding to fura-2 molecules in distinct states (from F2-1 to F2-3, red thick lines in A and B) were identified, whereas four autofluorescence components (thin lines of the same colors as in Fig. 5) with essentially the same spectra as in Fig. 5 were separated. Changes in the scores of spectral components (except AF-4) in response to FCCP (1 μM) and the following injection of IP3, together with the ratio of F2-2 (Ca2+-bound form) to F2-1 (Ca2+-free form), are plotted in C. An increase (decrease) in the ratio indicates a rise (fall) of intracellular Ca2+ concentration. (D–F) The spectra and the scores of three components identified in fura-2/BSA solutions. Spectral data were obtained from drops of Ca2+ buffers containing 2 μM fura-2 and 5 mg/ml BSA, at free Ca2+ concentrations of 0, 0.1, 0.6, and 40 μM. The third component (AF-3, dotted lines) was absent in BSA-free fura-2 solutions (see Fig. 2, B and C) and fura-2-free BSA solutions (not shown), and therefore corresponded to BSA-bound fraction of fura-2.

