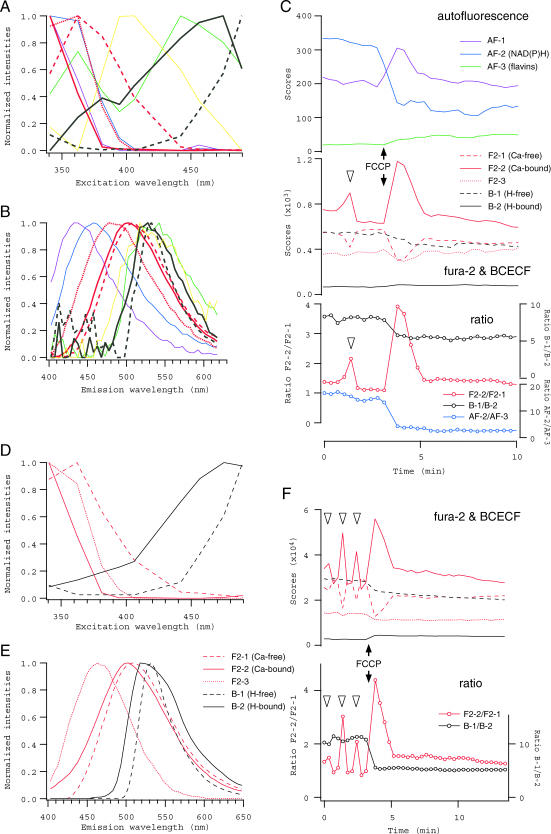
FIGURE 9.
Spectral decomposition of fluorescence from oocytes loaded with fura-2 and BCECF. (A–C) Excitation and emission spectra, and the scores of components obtained from the oocytes that were loaded mildly with fura-2 and BCECF. Three fura-2 components (red thick lines in A and B) and two BCECF components (black thick lines) were identified, whereas four autofluorescence components (thin lines of the same colors as in Fig. 5) were distinguished as well. Changes in the scores of each spectral component (except AF-4) in response to FCCP (1 μM), together with the ratios F2-2/F2-1, B-1/B-2, and AF-2/AF-3, are plotted in C. A decrease in the ratio AF-2/AF-3 indicates the oxidization in the oocyte. (D–F) The spectra and the scores of five components identified in the oocytes that were loaded with fura-2 and BCECF at higher concentrations. Triangles in C and F indicate spontaneous Ca2+ transients observed before FCCP application.

