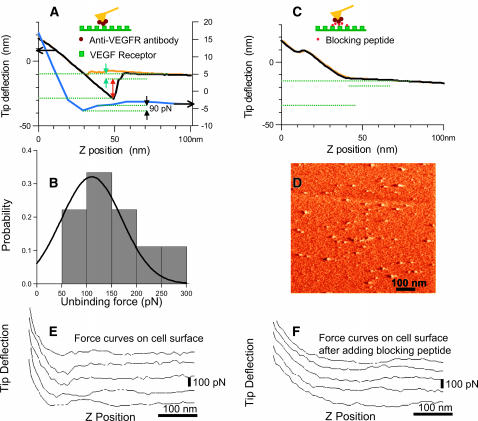
FIGURE 1.
Adhesion (unbinding/binding) forces between VEGF receptor and its antibody. (A) Adhesion force between isolated VEGF receptor (flk-1) adsorbed on the mica substrate and AFM tip conjugated with an antibody (anti-flk-1). The top AFM force curves with deflection scale to the left show the approach (yellow) and retract (black) curve, respectively. The retract curve reveals large multiple de-adhesion steps (arrows) and specific interaction between the antibody (anti-Flk-1) on the tip and the receptors on mica surface. The last unbinding step (green arrow) is attributed to unbinding of a single receptor-antibody pair. The lower blue curve (with deflection scale to the right) shows a more typical interaction. The expected single pair unbinding is ∼100 pN and might correspond to single/double binding. (B) Probability histogram of manually measured unbinding forces from force curves measured as in A. (C) Control; competitive inhibition. The force curve in A between the antibody on the tip and the receptors on mica surface is abolished by online addition of the blocking peptide against which the antibody was made. (D) AFM tapping mode amplitude image of the VEGF receptors sparsely distributed on a silanized mica surface. (E) Adhesion force between VEGF receptor (flk-1) on endothelial cell and AFM tip conjugated with an antibody (anti-flk-1). (F) Force curves on the cell after adding the blocking peptide. The force curves in E indicates larger adhesion force versus no adhesion force in the presence of the blocking peptide (F).

