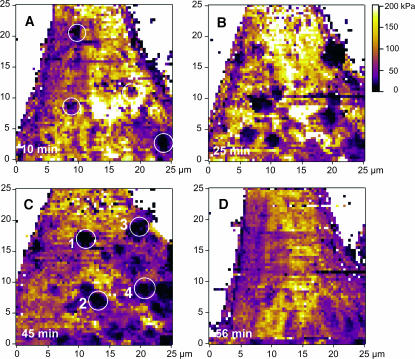
FIGURE 4.
Elasticity maps of the evaluated Young's modulus on endothelial cells in real-time, showing clustering of VEGF receptors on the cell surface. The images are color-coded according to the color bar, from 0 kPa (dark) to 200 kPa (bright yellow). The images show the elasticity at different time points after adding anti-flk-1 antibody in the imaging solution: (A) 10 min after addition; (B) 25 min after addition; (C) 45 min after addition; and (D) 56 min after addition. A few regions with lower elasticity are marked with numbers 1–4 in C. These are the same regions showing receptor clusters in Fig. 3 G (marked as 1–4). The regions underlying the receptor clusters appeared as less stiff.

