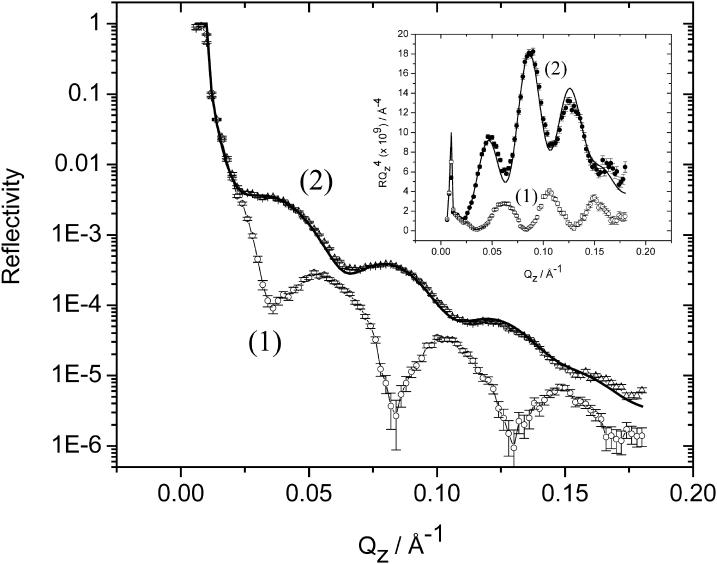
FIGURE 5.
Experimentally determined reflectivity curves (points with associated error bars) for E = 50 mV in 50 mM NaF in D2O. (Curve 1) The film-free electrode surface. (Curve 2) The electrode covered by a bilayer of the 7:3 mixture of h-DMPC and cholesterol. (Inset) Plot of RQ4 vs. Qz calculated from the data presented in the main section of this figure. Solid line shows the calculated reflectivity curves from the best-fit model whose parameters are given in Tables 2 and 3.

