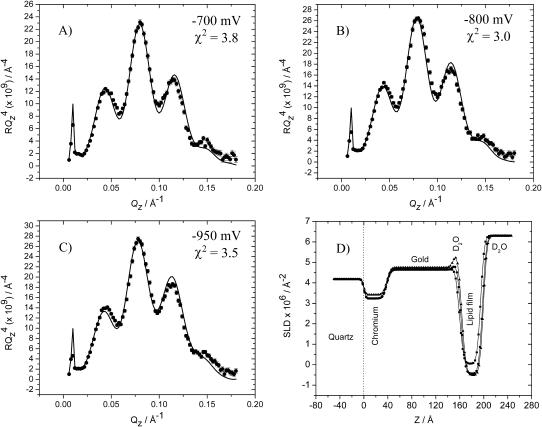
FIGURE 7.
(A–C) RQ4 vs. Qz plots for a bilayer of the 7:3 mixture of h-DMPC and cholesterol in 50 mM NaF in D2O, (A) at E = −700 mV; (B) at E = −800 mV; and (C) at E = −950 mV. Points with associated error bars show the experimental data. Solid lines show the reflectivity calculated from the parameters obtained from the fitting procedure. (D) The SLD profiles for the interface for E = −700 mV (▪); E = −800 mV (•); and E = −950 mV (▴). The best-fit model parameters corresponding to the SLD profiles are listed in Tables 2 and 3.

