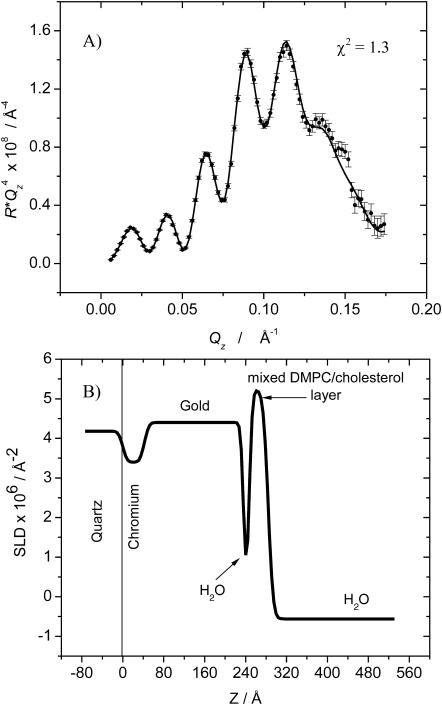
FIGURE 8.
(A) RQ4 vs. Qz plot for a bilayer of the 7:3 mixture of d-DMPC and cholesterol in 50 mM NaF in H2O at E = −800 mV. Points with associated error bars show the experimental data. Solid line shows the reflectivity calculated from the SLD profile presented in B. The best-fit model parameters corresponding to the SLD profile are listed in Tables 2 and 3.

