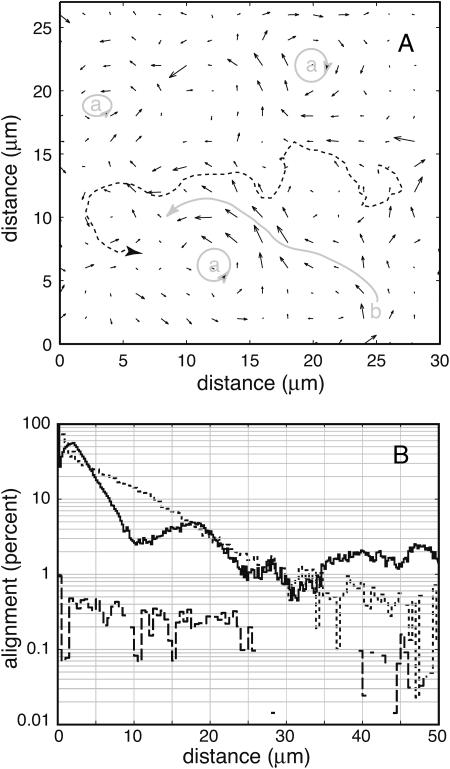
FIGURE 6.
Vector plot of velocities, and velocity correlations. (A) Fluid velocity immediately above the active surface (short arrows). The longest velocity vector corresponds to a speed of 60 μm/s. Several “whirlpools” (a) and a “river” (b) are indicated in gray. Velocities were calculated from video of 1 μm tracer beads, binned into 2 μm × 2 μm pixels and averaged over 60 s. Blank areas have no data. The dotted line shows a typical 10-s-long path of a tracer bead. (B) Semilog plot of flow-flow (solid line), cell-cell (dotted line), and cell-flow (dashed line) alignment as a function of distance r. The alignment parameters can be roughly interpreted as the percentage of objects at a distance r that are coaligned with an object at the origin, but see “Methods” for rigorous definitions. The hump in the flow-flow alignment curve (10 μm < r < 25 μm) is reproducible. It is caused by anticorrelation on opposite sides of whirlpools; the hump width is the average diameter of a whirlpool. The flow-flow and cell-cell parameters are normalized to 100% at r = 0. However, the flow-flow alignment is not reliable in the range  μm, due to a proximity breakdown in the tracking algorithm, and there is an artifact in the cell-cell curve at r < 1 μm caused by packing limitations of finite-size cells. Negative values are omitted, producing gaps in some curves. All three curves were taken from the same active surface, part of which is binned and plotted in A.

