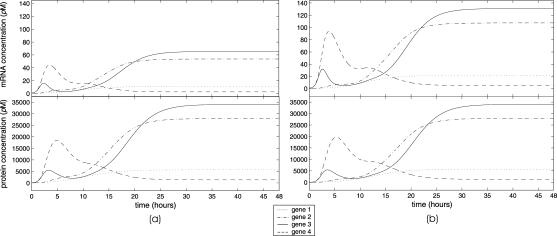
FIGURE 7.
Evolutions of mRNA and protein concentrations of the tRS depicted in Fig. 5 for the case of: (a) a twofold increase in the rate of translation and a twofold decrease in the affinity constant, and (b) a twofold increase in the rate of transcription and a twofold decrease in the affinity constant.

