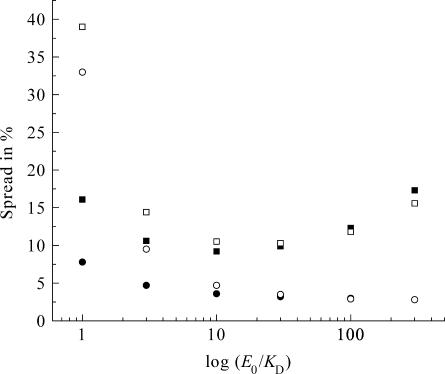
FIGURE 6.
Accuracy for both the KD and E0 at different conditions. Experimental conditions are as stated in the legend of Fig. 5. Squares represent the spread (%) in KD, circles the spread in E0: solid for two-parameter fitting (KD and E0), open for three-parameter fitting (KD, E0, and β).

