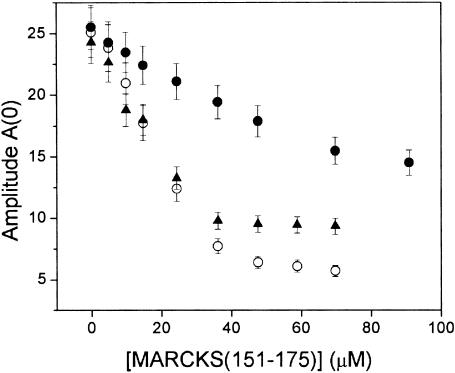
FIGURE 11.
Titration of the central (mI = 0) nitroxide EPR resonance, A(0), as a function of the concentration of added MARCKS(151–175). The titration is shown in vesicle suspensions of PC (○), PC/PS (9:1, ▴), PC/PS (7:3, •) at a total lipid concentration of ∼7 mM; proxyl-PIP2 is present at 0.85 mol%.

