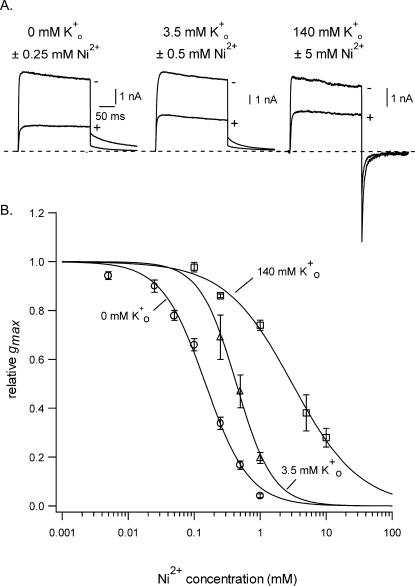
FIGURE 2.
Increasing [K+]o changes the concentration dependence of the block of Kv1.5 by Ni2+. (A) Representative traces obtained from three different cells showing, superimposed, the currents evoked in the Ko+ concentrations indicated either without (−) or with (+) the Ni2+ concentration indicated. The voltage protocol consisted of a 300-ms step from −80 mV to 50 mV followed by a step to −40 mV. Increasing [K+]o necessitates a higher concentration of Ni2+ to produce roughly the same degree of block. The time calibration is the same for the three sets of traces. (B) The concentration-response relationship for Ni2+ in 0, 3.5, and 140 mM Ko+ shows that increasing [K+]o from nominally K+-free to 3.5 mM shifted the KD from 0.15 ± 0.01 mM to 0.44 ± 0.02 mM. Increasing Ko+ to 140 mM shifted the KD for the Ni2+ block to 3.1 ± 0.3 mM. Each point represents the mean ± SE of measurements from three to seven cells.

