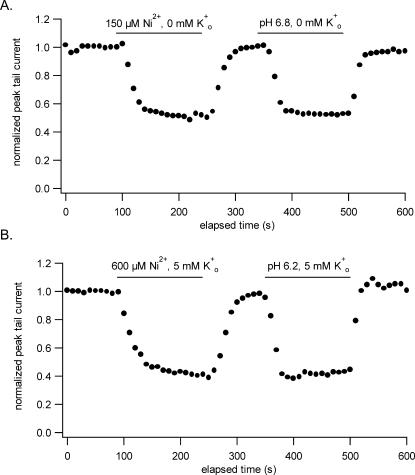
FIGURE 3.
A comparison of the time course of the onset and offset of the inhibition of Kv1.5 by Ni2+ and Ho+. Concentrations of Ni2+ or Ho+ producing ∼50% steady-state inhibition with 0 mM Ko+ (A) and, in a different cell, with 5 mM Ko+ (B) were used. Peak tail currents measured at −40 mV after a 300-ms depolarization to 50 mV applied at a 10-s interval are plotted against the elapsed time. The horizontal bar indicates the duration of each application. The results do not reveal any obvious asymmetry in the onset versus the offset of the block either with or without Ko+. As with Ho+, the time course for the development or reversal of the Ni2+ block was similar and in both cases is presumed to reflect the time course of solution exchange in the bath.

