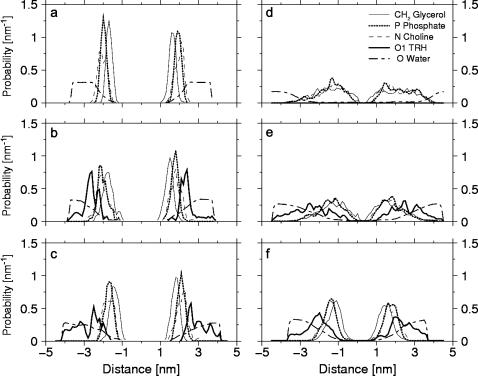
FIGURE 4.
Normalized density profiles for specific atoms of DPPC, TRH, and water along the bilayer normal (z axis) calculated for the simulations without TRH (a and d), with TRH 1 m (b and e), or with TRH 2 m (c and f), at either 325 K (left panels) or 475 K (right panels). The profiles correspond to averages over the last 0.25 ns of each simulation.

