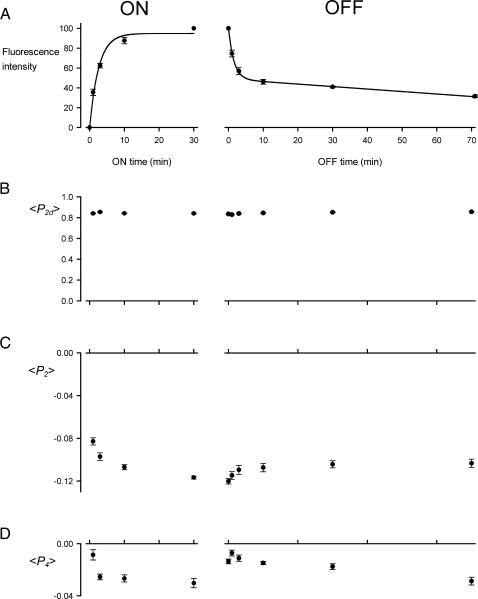
FIGURE 2.
Kinetics of RLC exchange in single muscle fibers. (A) Total fluorescence intensity from 100-BR-108 in the fiber, normalized by the value after a 30-min exchange. (B–D) Order parameters 〈P2d〉, 〈P2〉, and 〈P4〉, respectively. All measurements were made in exchange solution at 10°C. The time axis shows the duration of exchange at 30°C in the presence of 100-BR-108 RLC (ON experiment) or unlabeled wild-type RLC (OFF experiment). Mean ± SE for five fibers (ON) or six fibers (OFF); the lines in A are an exponential fit (ON) and exponential plus linear component (OFF).

