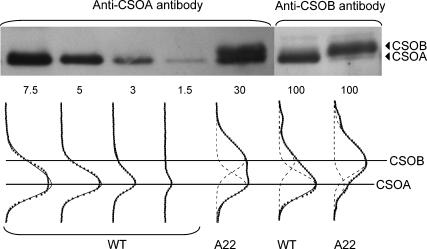
FIGURE 3.
Comparative immunoblot analysis of CSOA and CSOB in the wild-type and CSRA-RNAi transformant A22. (Top) Immunoblots of cell extracts treated with the anti-CSOA or anti-CSOB antibody; the amount of total protein per lane in micrograms is indicated below the image. (Bottom) Density profiles of the blots (solid squares) and their fit with asymmetric Gaussian functions (dashed lines, individual peaks; solid lines, superposition of the peaks).

