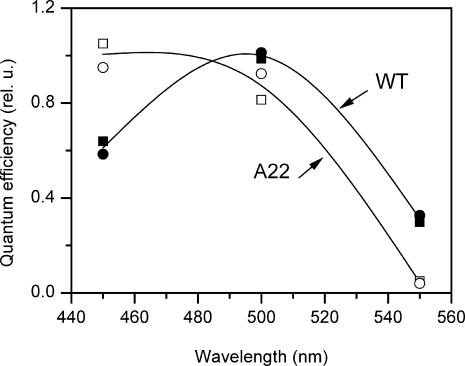
FIGURE 8.
Spectral sensitivity of the photophobic response in the wild-type (solid symbols) and CSRA-RNAi transformant A22 (open symbols). Results of two independent experiments for each strain are indicated by the symbol type. Data were normalized to the mean sensitivity at the most efficient spectral band.

