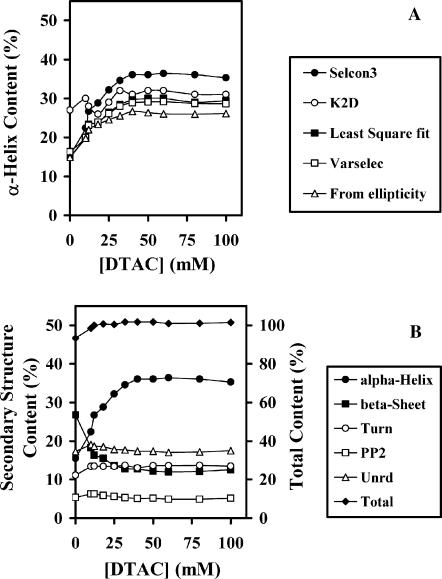
FIGURE 3.
Secondary structure content of BLG, evaluated from far-UV CD spectra, as a function of the DTAC concentration. (A) Fractional content in α-helixes, obtained with several programs from Dicroprot 2000. (B) Fractional content in α-helixes, β-strands, turns, poly(Pro)II, and unordered fraction (scale at left), and total secondary structure content (scale at right), obtained with the program SELCON3, from Dicroprot 2000.

