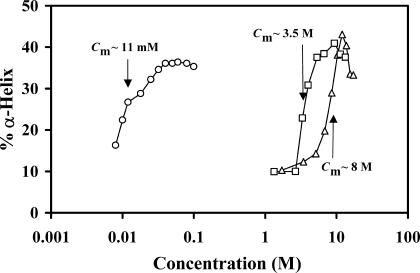
FIGURE 6.
Comparison of the α-helical content of BLG, evaluated with the program SELCON3, in the solvent systems ethanol-water (▵), propanol-water (□), and DTAC-water (○), as a function of the “denaturant” (alcohol or surfactant) concentration. “Denaturant” concentrations at the midtransition point, Cm, are indicated. A logarithmic abscissa scale was used because of the quite different concentration regimes where the β→α transition occurs, for DTAC and the alcohols.

