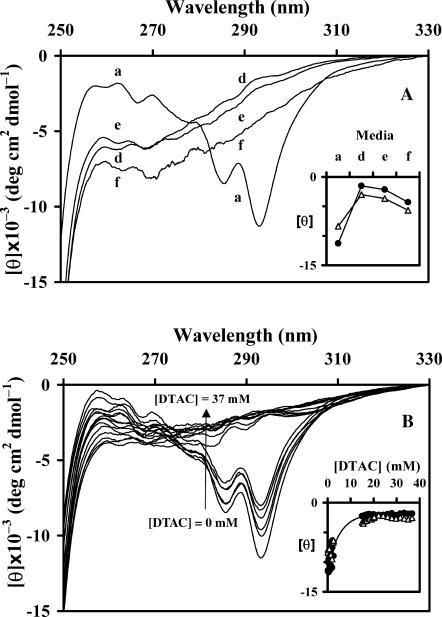
FIGURE 7.
Near-UV CD spectra of BLG: (A) in water (a) and in media d–f (see Table 1); (B) in DTAC aqueous solutions, as a function of the DTAC concentration. The insets show the evolution of [θ]293 (•) and [θ]285 (▵) as a function of the medium (A) or the DTAC concentration (B).

