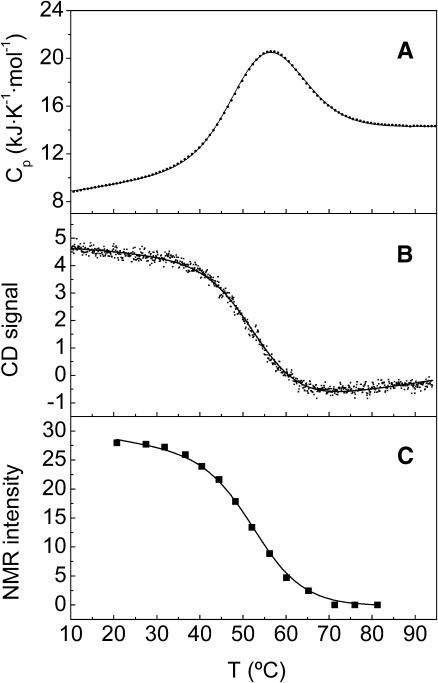
FIGURE 2.
Thermal unfolding profiles of spc-SH3 in 20 mM glycine, pH 3.0, observed by several techniques. (A) Partial molar heat capacity versus temperature obtained by DSC. (B) Far-UV CD at 222 nm versus temperature. (C) Temperature dependence of the 1H-NMR signal intensity corresponding to the Ala55 methyl proton in the native state. Spc-SH3 concentrations were 0.76 mM (A), 0.69 mM (B), and 0.68 mM (C), respectively. Symbols represent the experimental data. Solid lines correspond to the curves predicted by the three-state model described in the text using the parameters of Table 2 for data set C.

