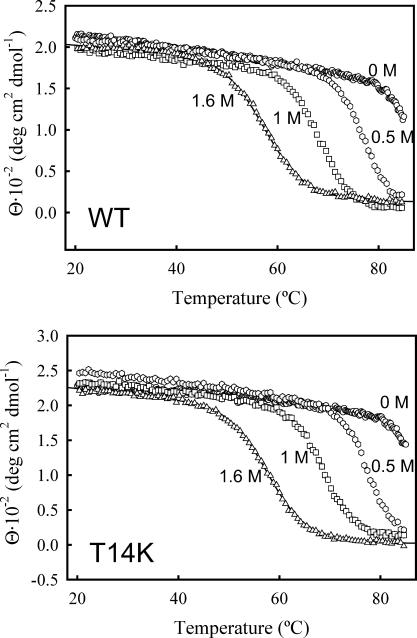
FIGURE 3.
Thermal denaturation of WT thioredoxin and the T14K variant at pH 7 as followed by the ellipticity at 280 nm. The numbers alongside the denaturation profiles stand for the guanidinium chloride concentration in the solution. The solid line represents in both cases (WT and T14K) the best fit of the two-state model to the denaturation profile for 1.6 M guanidinium chloride (see Materials and Methods for details) for which both pre- and posttransition baselines are observed. From these fittings, we obtain Tm = 58°C and ΔHm = 223 kJ/mol for the WT form, and Tm = 58°C and ΔHm = 235 kJ/mol for the T14K variant. These noncalorimetric estimates are in good agreement with the calorimetric values shown in Fig. 5.

