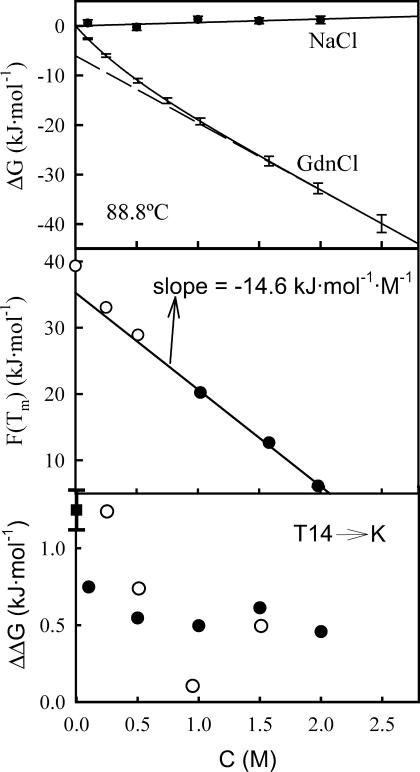
FIGURE 7.
(Upper panel) Plots of denaturation Gibbs energy at 88.8°C versus salt (NaCl or guanidinium chloride) concentration. For NaCl, the solid symbols represent the experimental data and the line is the best fit of a straight line to them. For guanidinium chloride, we show (solid line) the ΔG versus C profile calculated using Eq. 7 and based on the m1/2 versus C data of Fig. 6 (upper panel). We also show for guanidinium chloride (dashed line) the dependency given by the linear extrapolation of the high guanidinium chloride concentration data. (Middle panel) Plot of the right-hand side of Eq. 12 versus guanidinium chloride concentration for WT thioredoxin denaturation. Solid symbols refer to guanidinium chloride concentration of 1 M or higher; the solid line represents the best fit of a straight line to those data. The three values corresponding to denaturant concentration <1 M are shown with open circles to highlight deviation from linearity. (Lower panel) Effect of NaCl (solid circles) and guanidinium chloride (open circles) on the effect of the T14→K mutation on thioredoxin stability (ΔΔG = ΔG(T14K) − ΔG(WT)). The error associated with the ΔΔG value in the absence of salt (solid square) has been derived from three sets of DSC experiments with the two protein forms; we believe this error to be roughly representative of those corresponding to the ΔΔG values in the presence of salts.

